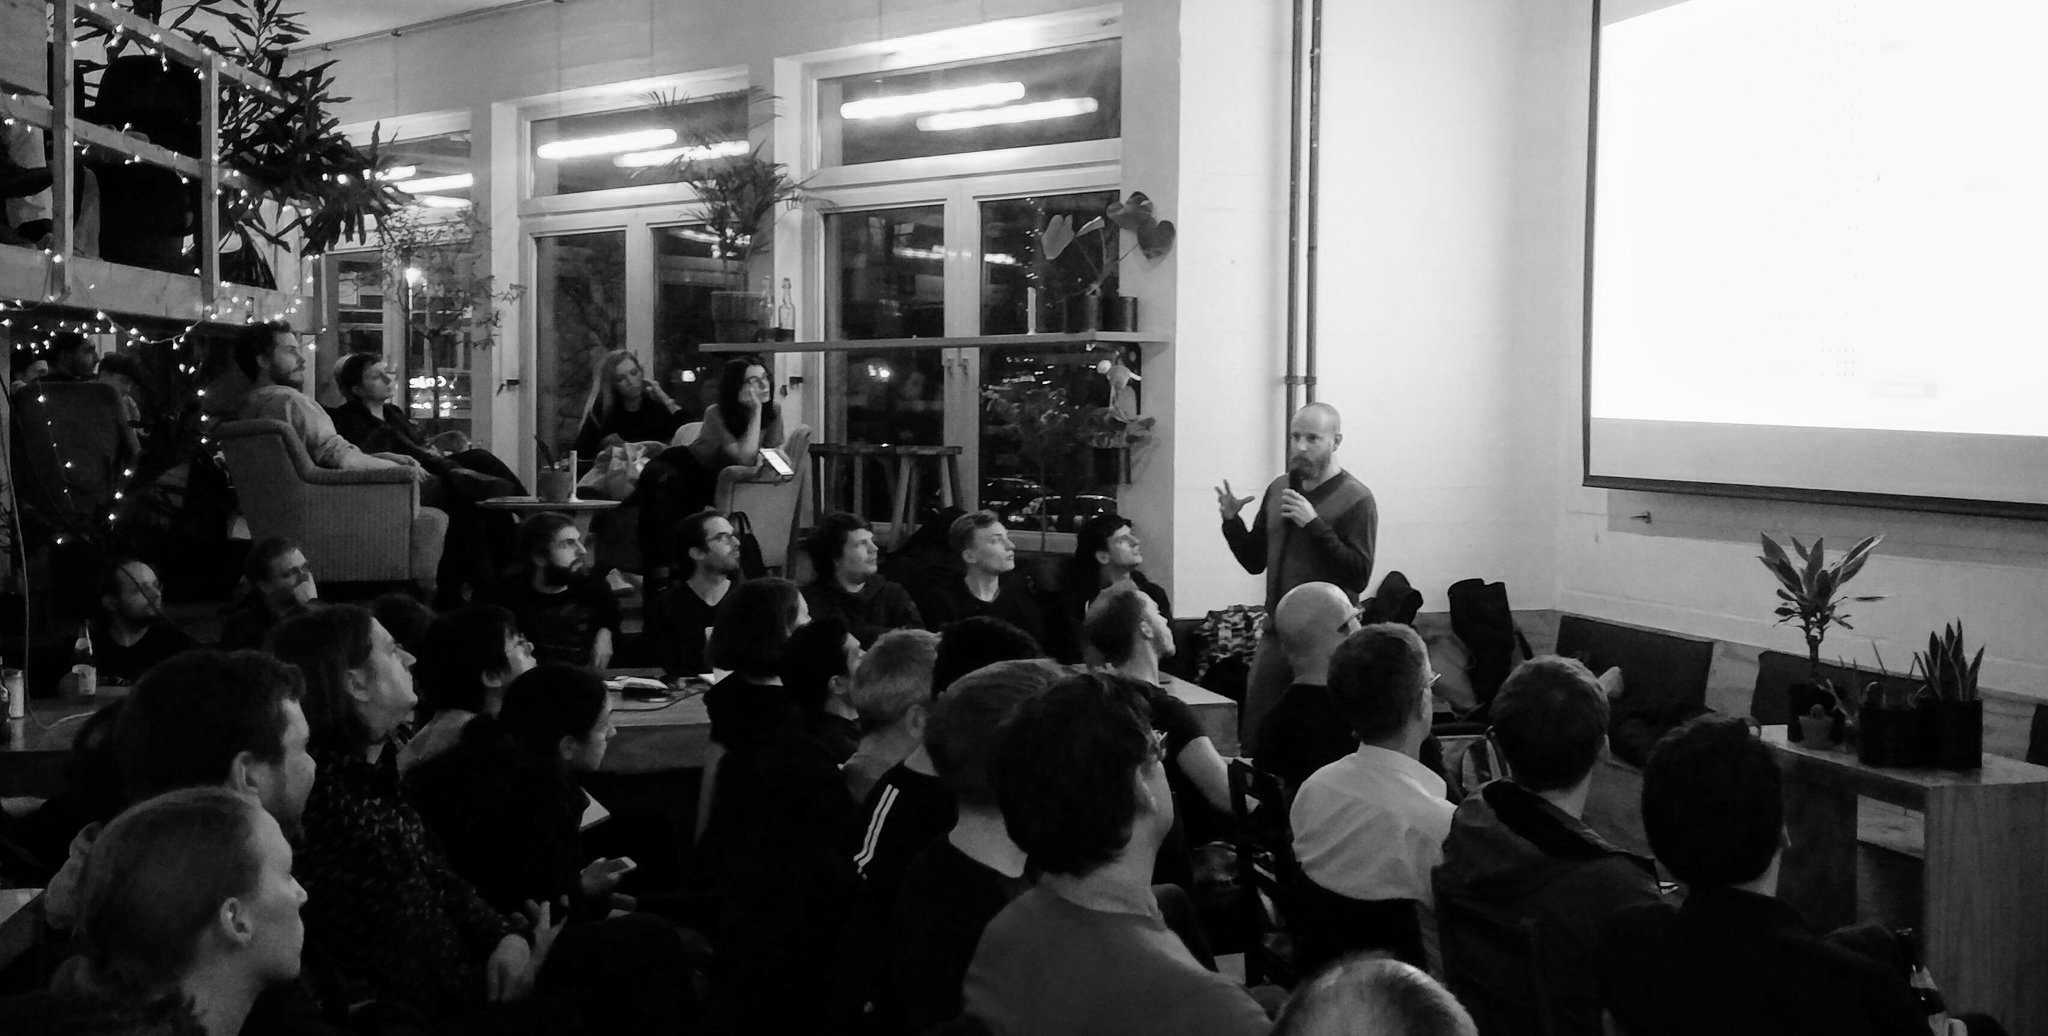
 Maarten Lambrechts at the Data Vis Meetup Berlin, January 2018
I first attended the Data Vis Meetup Berlin on August 25, 2014, as a fresh graduate who just moved to Berlin for a job. Francesco Occhipinti had started it and organized it a “Monthly Visualisers Gathering” once a month in the hacker space c.base. Back then, everyone could present something spontenously – but most often, it was simply a nice space for people to hang out and meet other people.
Over the next meetups, Francesco and I started talking. He was looking first for a co-organizer, and eventually for a main organizer as he moved away from Berlin a few months later. I changed the locations for the event so that more people could attend (we mostly used the Betahaus in Kreuzberg), and started inviting speakers – which attracted a bigger audience. Between summer 2015 and summer 2016, I organized the Data Vis Meetup by myself, before convincing the wonderful Jonas Parnow to join me. Here are some the events I organized:
July 2015: Data Journalism
- Moritz Klack about projects of the Berliner Morgenpost
- Nicolas Kayser-Bril, Journalism++, about The Migrants Files
- Paul Blickle, Zeit Online, about current data vis projects
September 2015: FH Potsdam: Profs, Alumni, Students
The meetup focuses on the University of Applied Science in Postdam and its “Interface Design” programme. Their great profs, students and alumni advance the field of data vis through their courses, research, a public talk series and the new Urban Complexity Lab.
- Marian Dörk (prof) about ongoing projects
- Till Nagel (prof) about projects from his course
- Kim Albrecht (alumnus) about work in progress
- Christian Gross (alumnus) about his bachelor thesis
- Jonas Parnow (student) about his master thesis
- Flavio Gortana (student) about his project Isoscope 2.0.
October 2015: On the Edge
In this edition, we looked beyond the horizon and ask: What can data vis be? Where are the borders? Where is the edge?
- Stephan Thiel, NAND, about physical representation of data
- Paul Heinicker about physical representation of data
- Catalina Pérez López, freelancer, about handmade visualisations
- Sonja Heinen about her project “Battersea Concert Park”
- Tobias Zimmer about his bachelor thesis
November 2015: Science Vis
- Tim Florian Horn, director of the Zeiss-Großplanetarium Berlin, about science vis in 360°
- Miriam Quick about the challenges of communicating scientific topics to a general audience
- Jeremie Gerhardt, color scientist, about a color experiment
- Eduard Parsadanyan, biostatistician, about his model of color vision systems
July 2016: In Progress
We talk about data vis projects which are not quite there yet and could need some help: Projects in Progress.
- Me on goals and workflows in data vis
- Sebastian Meier, vis researcher, about a side project on visualizing air pollution
- Philipp Bock on his interactive version of a chart that only compares the latitudes of cities, not their longitudes.
- Afri Schoedon about his vis project on reachability of transportation networks
- Christina Munoz about her Github visualization
January 2017: Data Tools
- Lars Grammel about the data wrangling startup Trifacta
- Me about trying out different data vis tools
- Jonas Parnow about his small data wrangling tools
- Sebastian Sadowski about building tools with clients in an agile way
- Gregor Aisch about the future of open source data vis tools
- Beni Buess about NZZ’s data vis tool Q
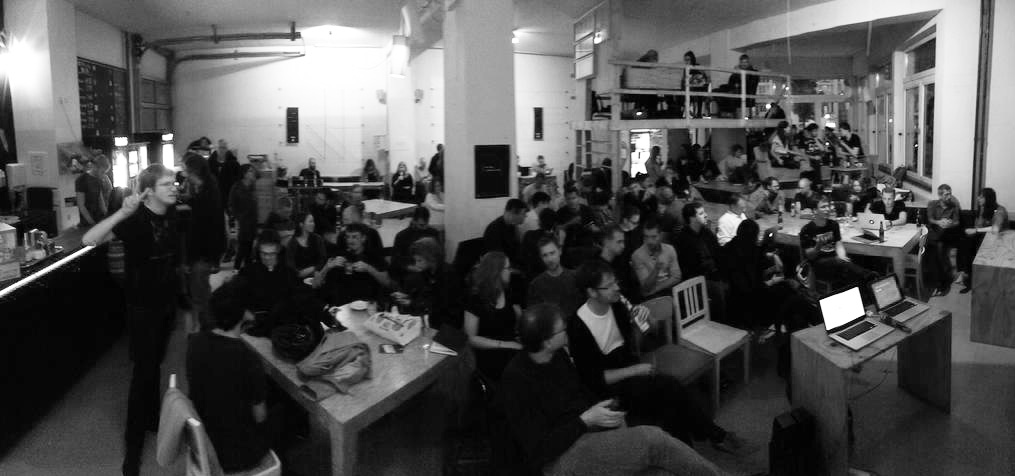 A data vis meetup I organized in 2015. Photo by Kim Albrecht.
Nice things people have said about the Data Vis Meetup