Today I worked on on a graphic with Alyson, I worked on a blog post and had dinner with Chloe from the Bloomberg Visuals team.
The data for the graphic was… not awesome. Which always gives me the feeling that it doesn’t matter what I’m doing because everything underlying is arbitrary. Also, I didn’t do a good job communicating with Alyson about the status of the graph, and my bad communication skills made me upset about myself. Hm.
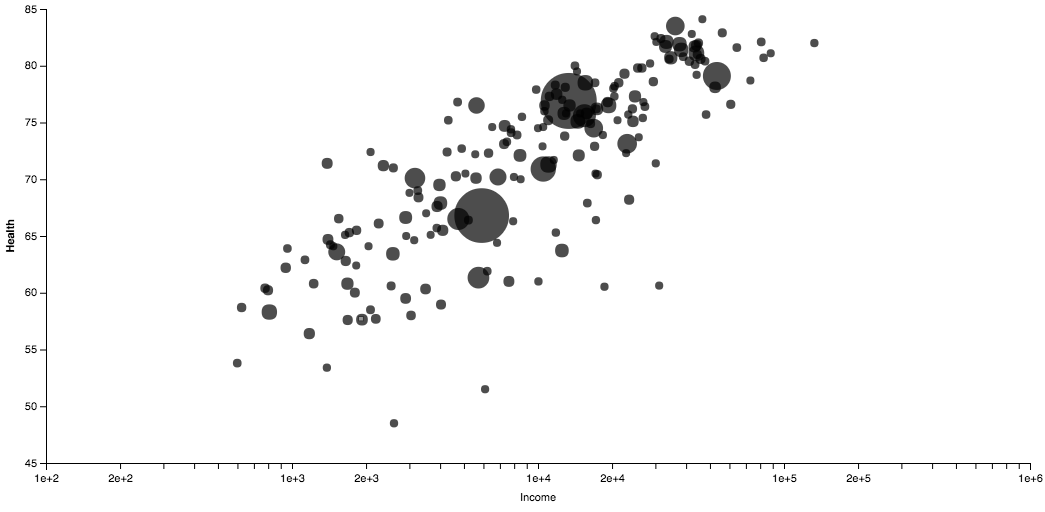
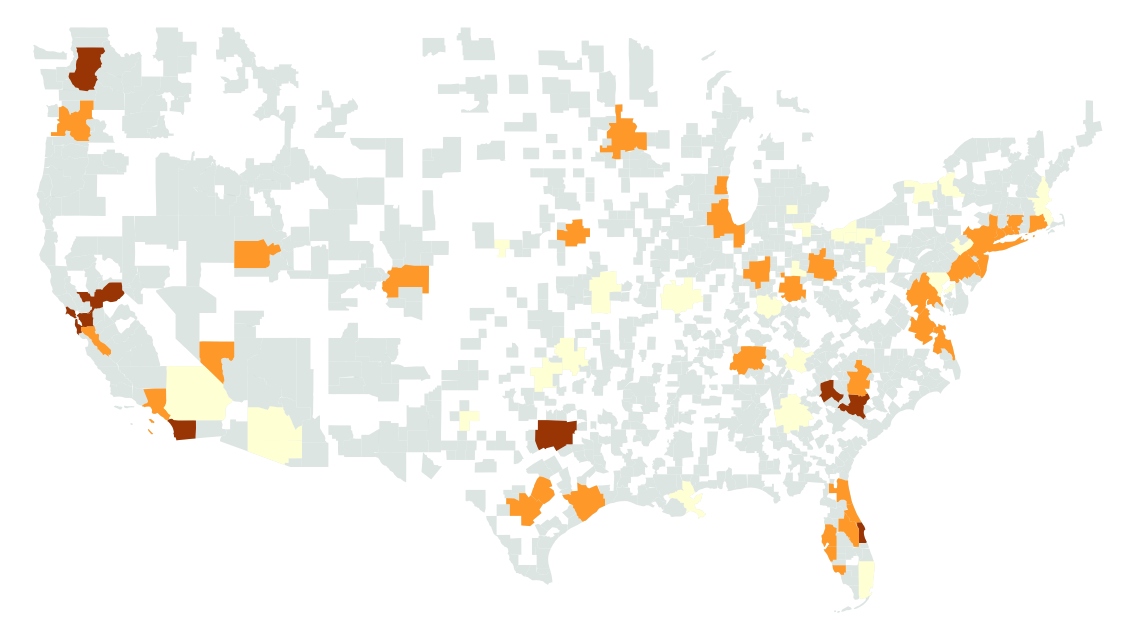
To work on the blog post was fun, though! I had the idea for a “1 chart, 10 tools” post and learned a lot during the process. I wonder how I can communicate my findings best. The current way doesn’t seem like the one from which people would get the most of.
With Cloe, I finally went to H street and had the best Ramen in town so far (at Toki Underground). Then we went to the first hipster place I’ve seen in DC so far: coffee, people with MacBook sitting there, overpriced chocolate and indie magazines: I felt very, very much reminded of Berlin and very much at home.
Input? 4
Output? 7
Learnings?
I should use Lyra more often. It’s such a good tool.
One goes to baseball games because it’s a) nostalgic and b) relaxing (because nothing is happening).
QGis has histograms for color bins! OMG! It’s so good! You can even change the bins IN the histograms!
Tweetdeck makes me interact more on Twitter.
The streetcars on H street are new and still free for the next 6 months, so that “people get used to them”. Which might backfire.
Questions?
What do I want people to take away from my blog post(s)?