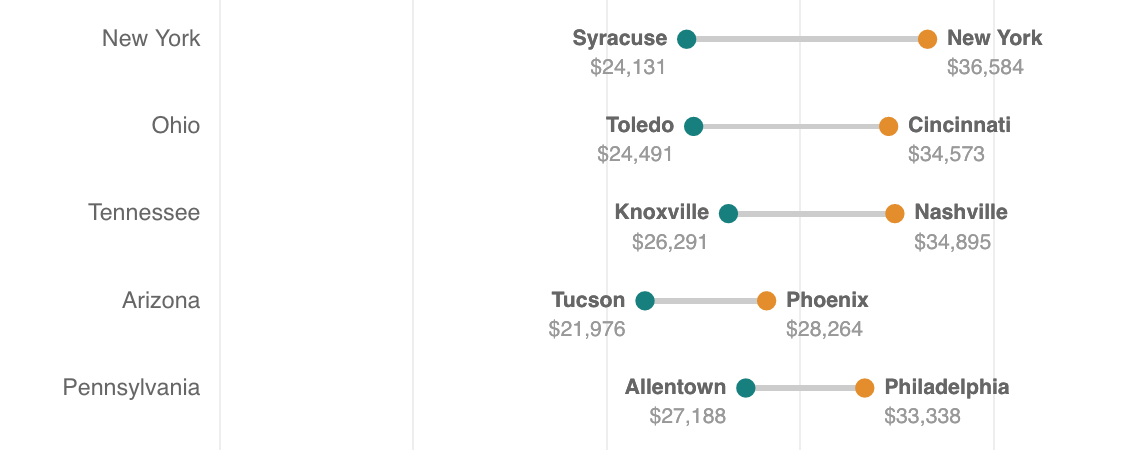
I made a chart I made a a chart I made a chart! The first half of my day was focused on making the bottom chart in this article. So I did some CSSing and lots of D3ing. The last time I used d3.js was…in November 2014, if I recall correctly. (But it was amazing how much I still remembered! I was super proud and positively surprised, although I’m not sure if I can blame d3 or me for that.) That graph was build with the graphics rig that the Visuals Team built here, which is a compromise between “we still need to touch the code of every graph we build” and “but we make it easier for editors to edit text and data in our graphs and we have templates and publishing works like a charm”
The second half of my day I spent with active reading. Meaning, I read through the first articles “Aristotle’s Poetics for Screenwriters” and wrote down the main points from each chapter. And I learnt a lot; it’s a really good book.
Input? 8
Output? 8
Learnings?
Don’t let you agenda seep into the story. Don’t serve your agenda, serve the story.
It’s all about the action, not the characters. The action changes the character. Stories “are an imitation not of persons but of action and life.”
In stories we want to raise, develop and answer ONE central question that we plant in the audience’s brain.
If you don’t need an element to tell the story, TAKE IT AWAY = make the story tight. Each element of the story needs to be necessary.
Events in stories should be connected by “therefore” or “but”, NOT by “and then”
Questions?
How can I apply my fresh storytelling knowledge to my blog posts and presentations?