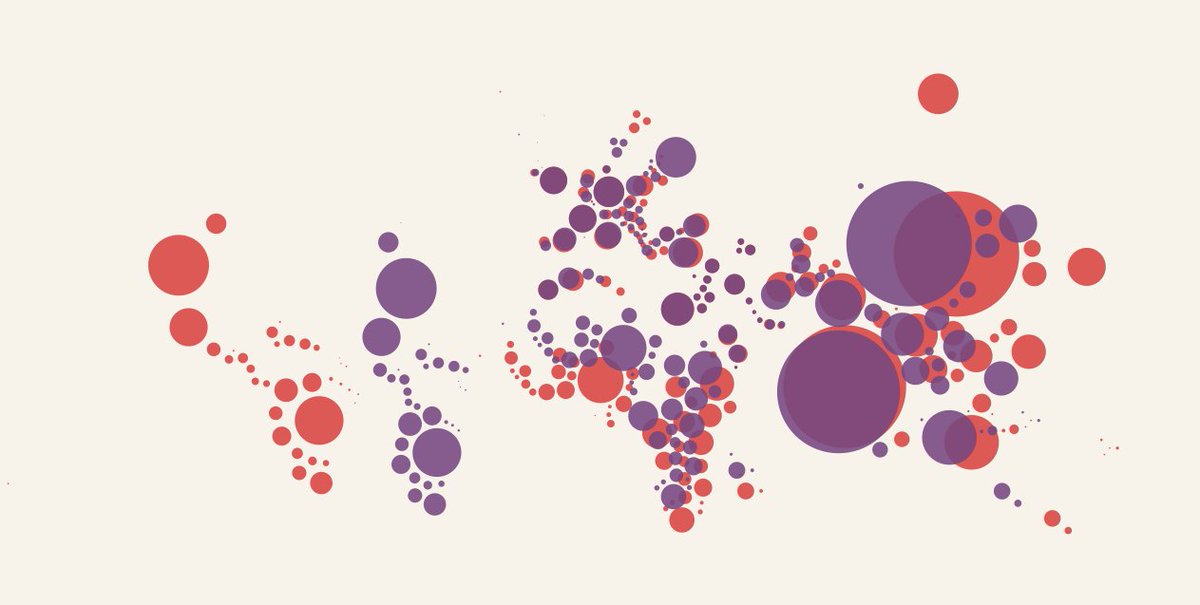
I’m very happy to show you what I’ve been working on for the last two weeks: 🎉 Cartograms 🎉 for @Datawrapper!
Let me know which cartograms you consider useful (which types? for which regions/countries?) I hope to add more of them soon. blog.datawrapper.de/cartograms/
Likes: 101 | Retweets: 18
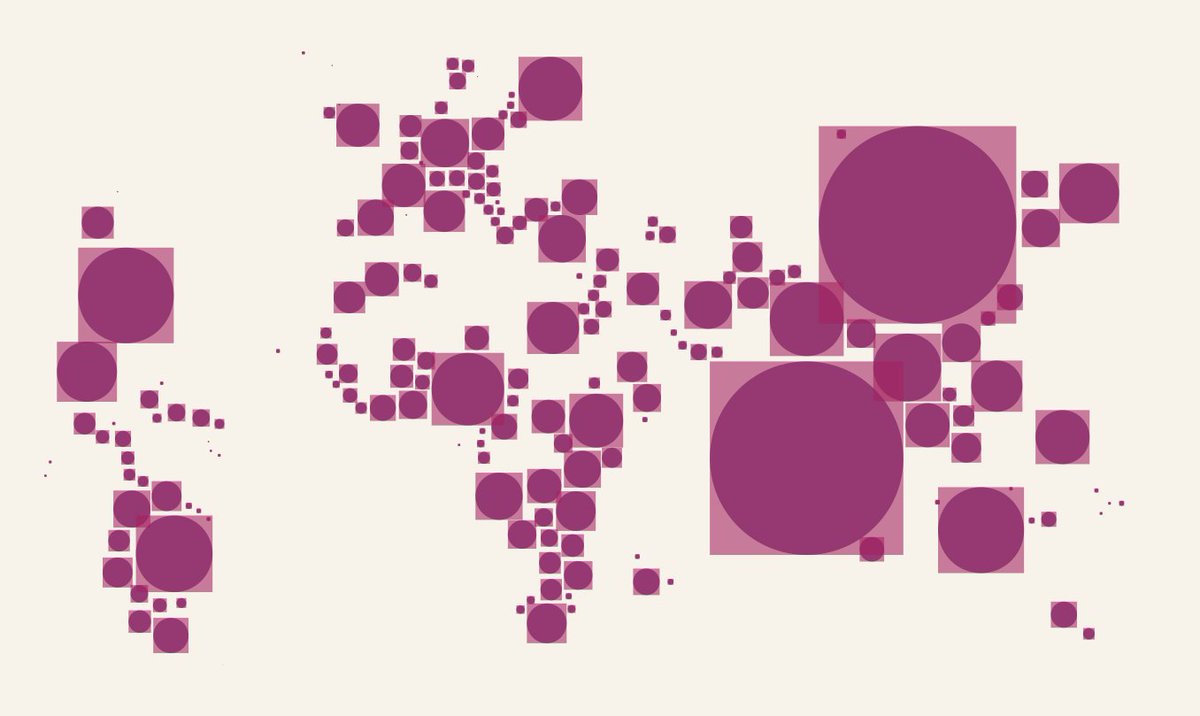
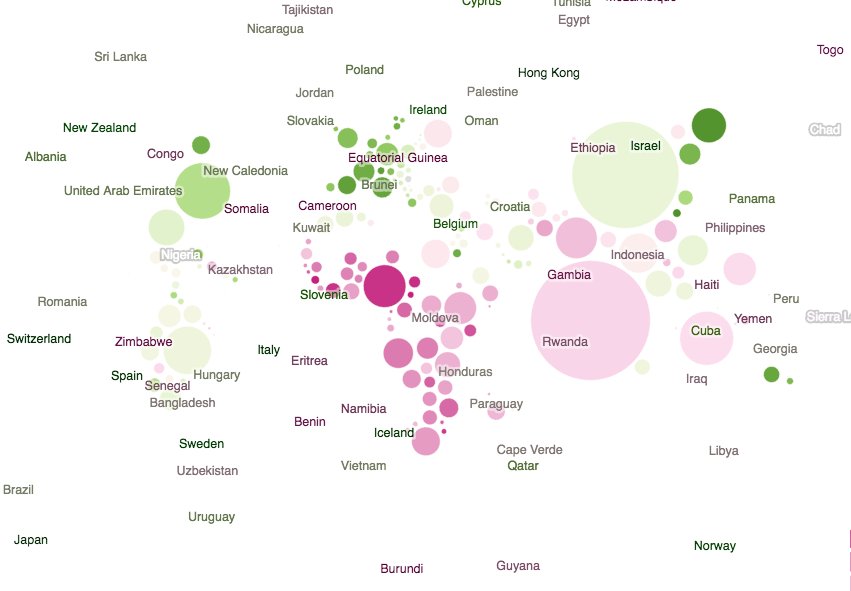
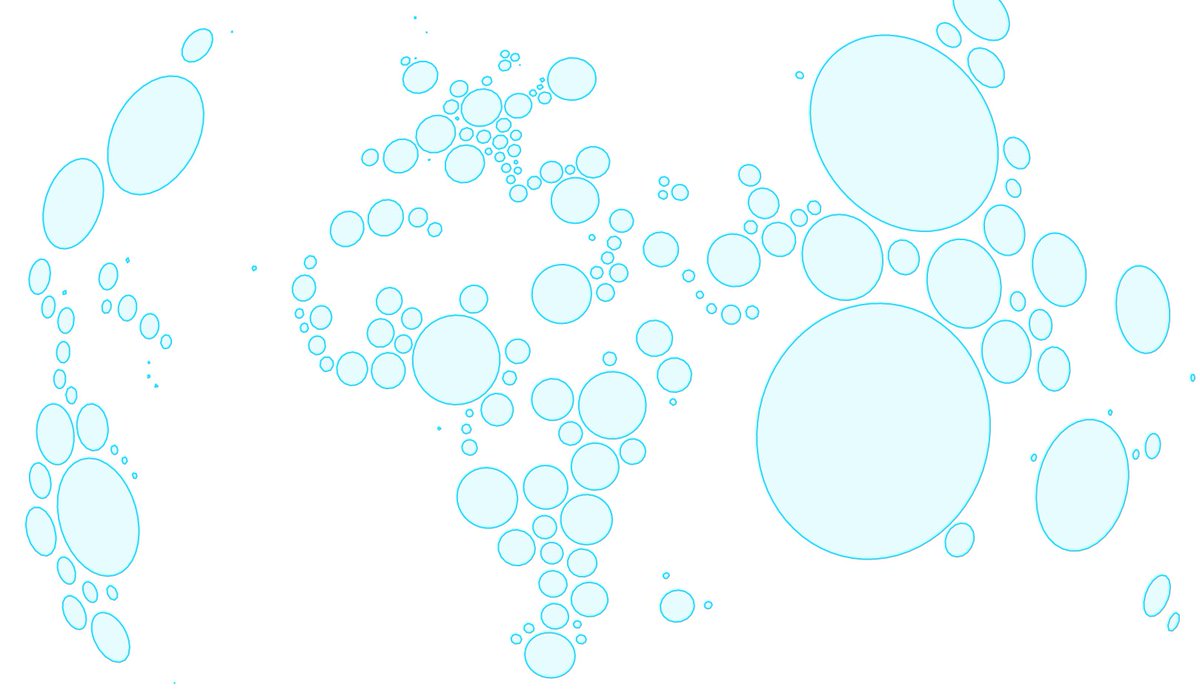
If you’re curious how I made them: In QGIS, “Polygon centroids” for all regions, then “Variable distance buffer” with population size as the variable. Then moving them around until happy.
Here are my favorite outtakes of that process.
Likes: 30 | Retweets: 1