I couldn’t let go of that idea to analyze existing color palettes out there – conveniently. So today I tried to automate that process. I found two good Figma plugins (Color Blind and Contrast Grid) that let me easily see how a list of hex codes look like for different colorblindnesses, and that calculated the contrast ratio to a white (or black) background.
But Viz Palette has these marvelous arcs that show you which colors can get easily confused with each other. I wanted to reproduce them.
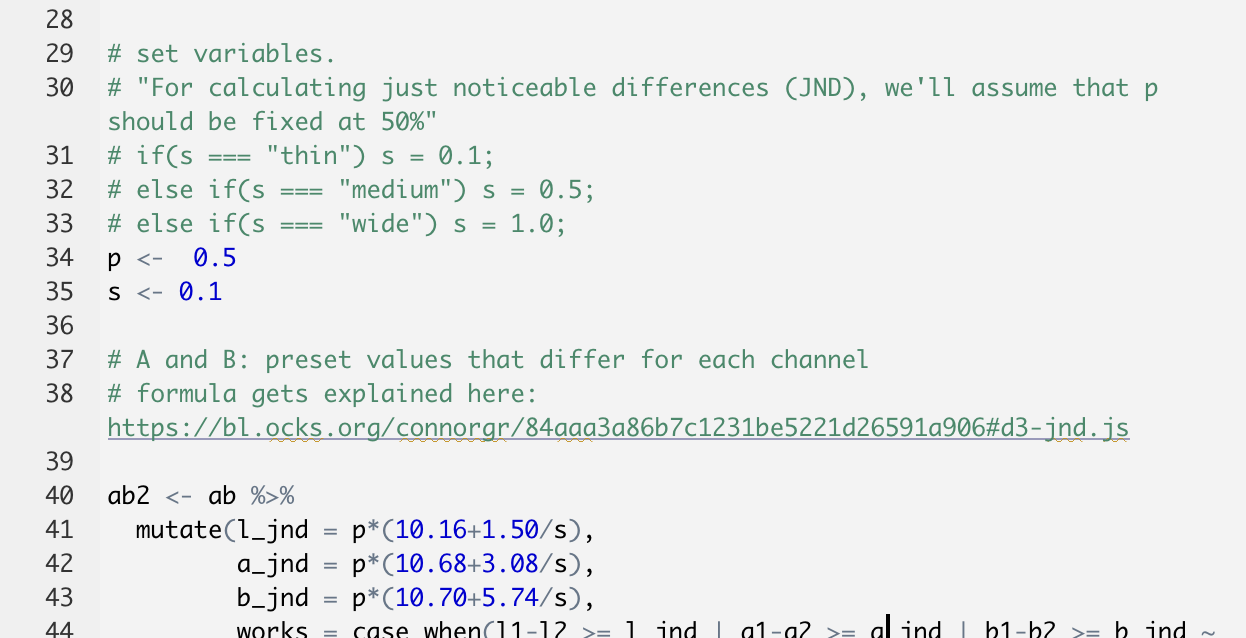
They’re based on Connor Gramazio’s https://github.com/connorgr/d3-jnd library. Turns out, it’s really not that much code…and because I don’t know much Javascript but I do know a bit of R, I attempted to rebuild it in R. As you can see above. The idea is to give that R script the hex codes of a color palette, and then get back which of these colors can get confused with each other in which kind of color vision. I feel like I made good progress (but the code also doesn’t work yet, I believe).
That was fun so far.