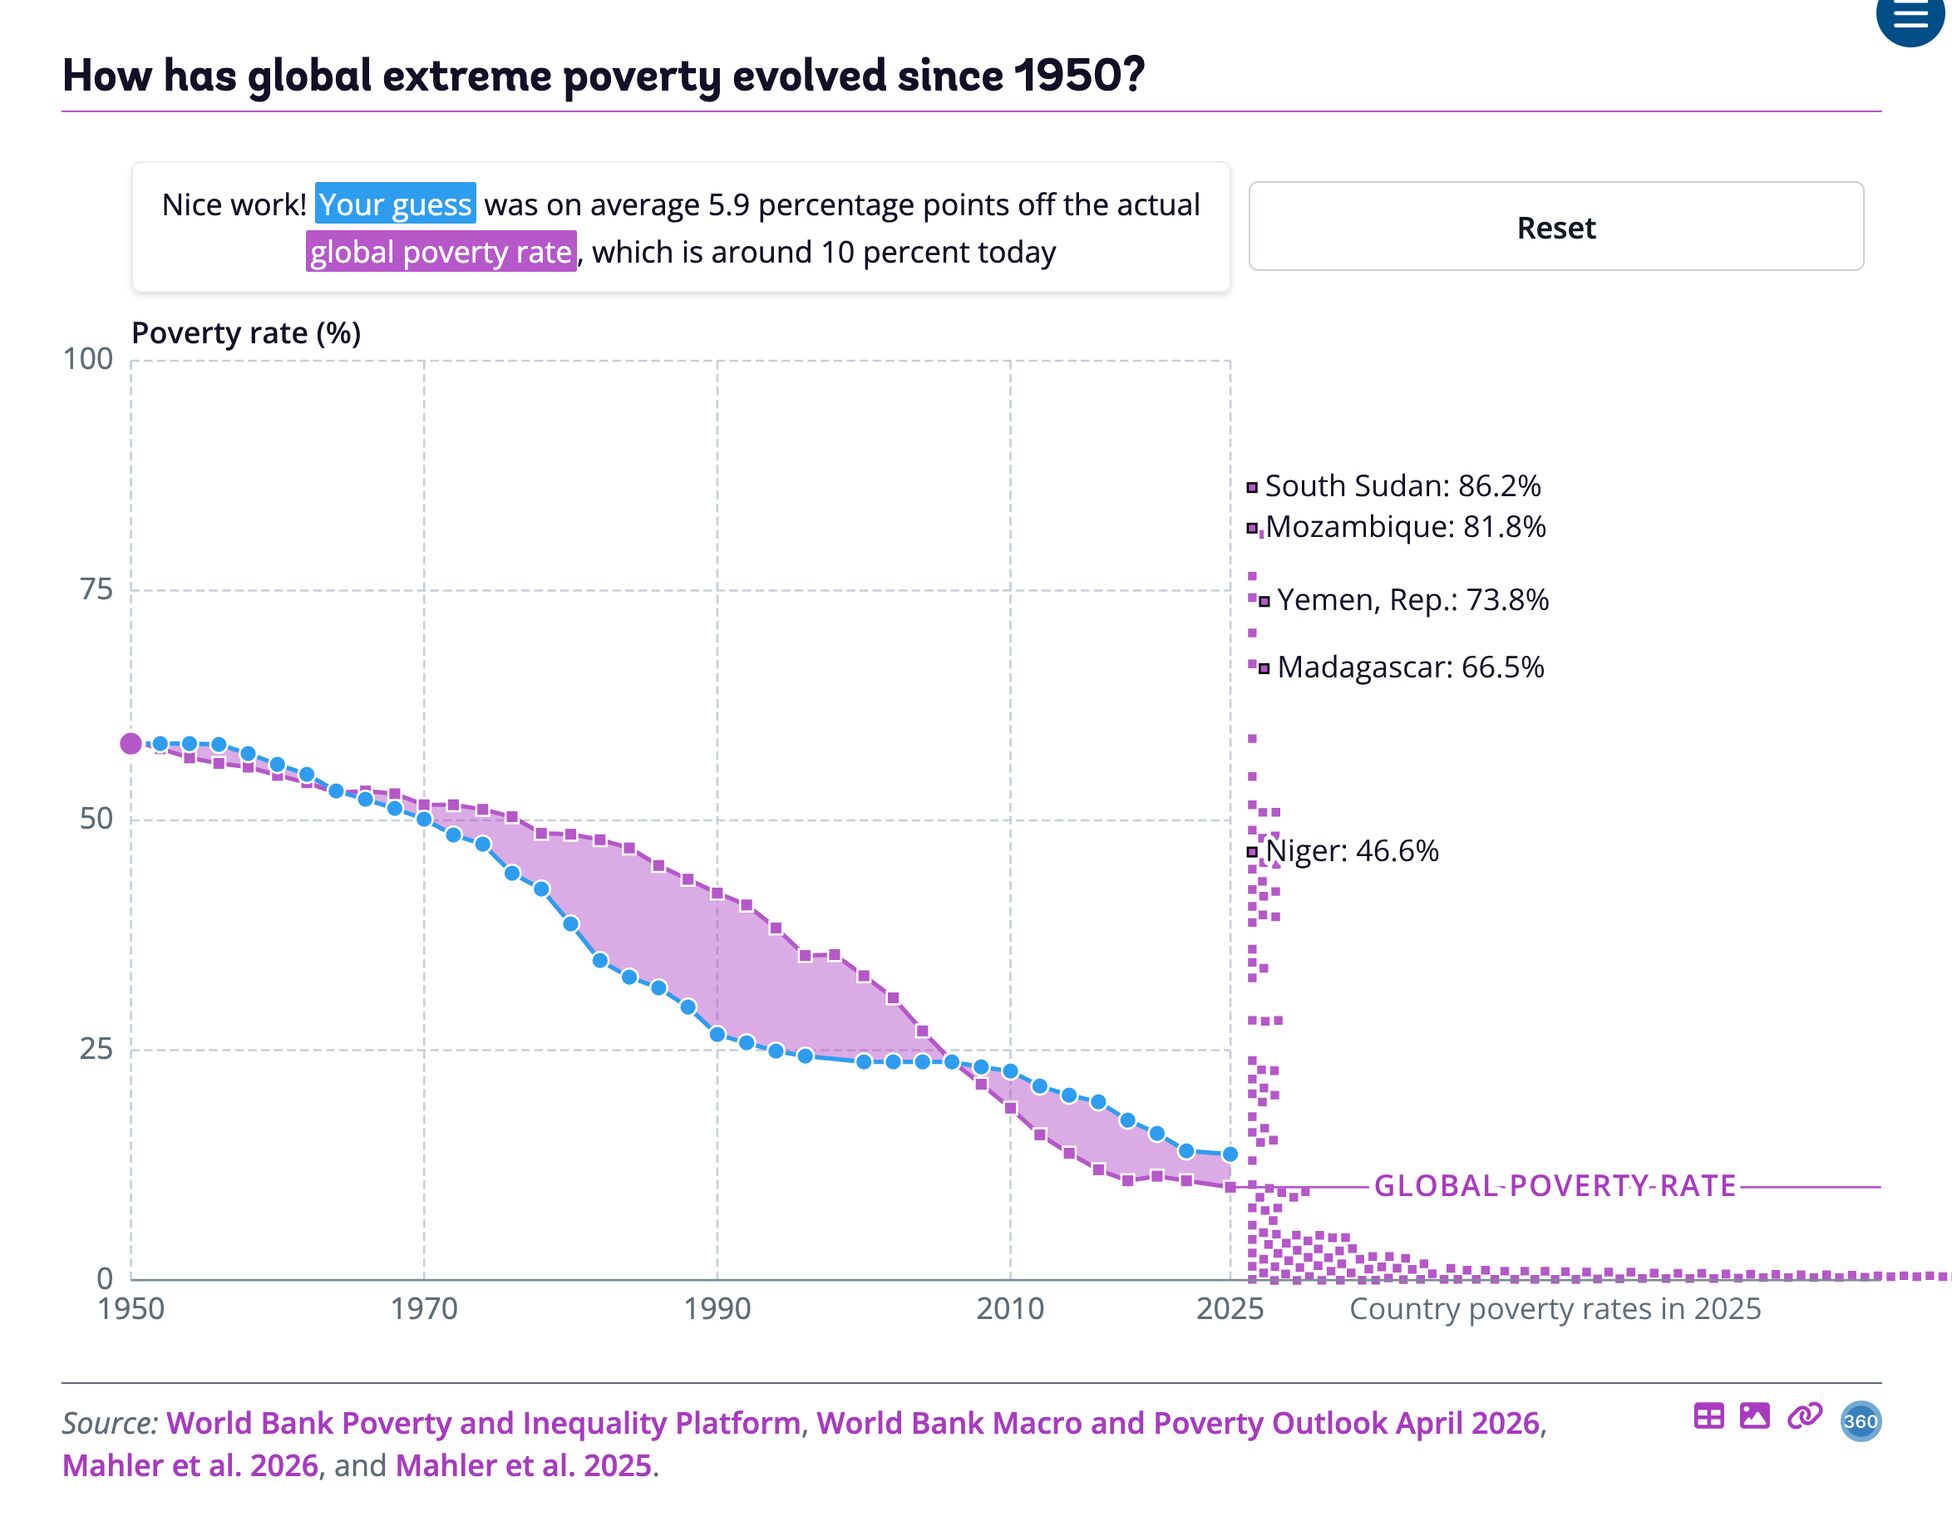
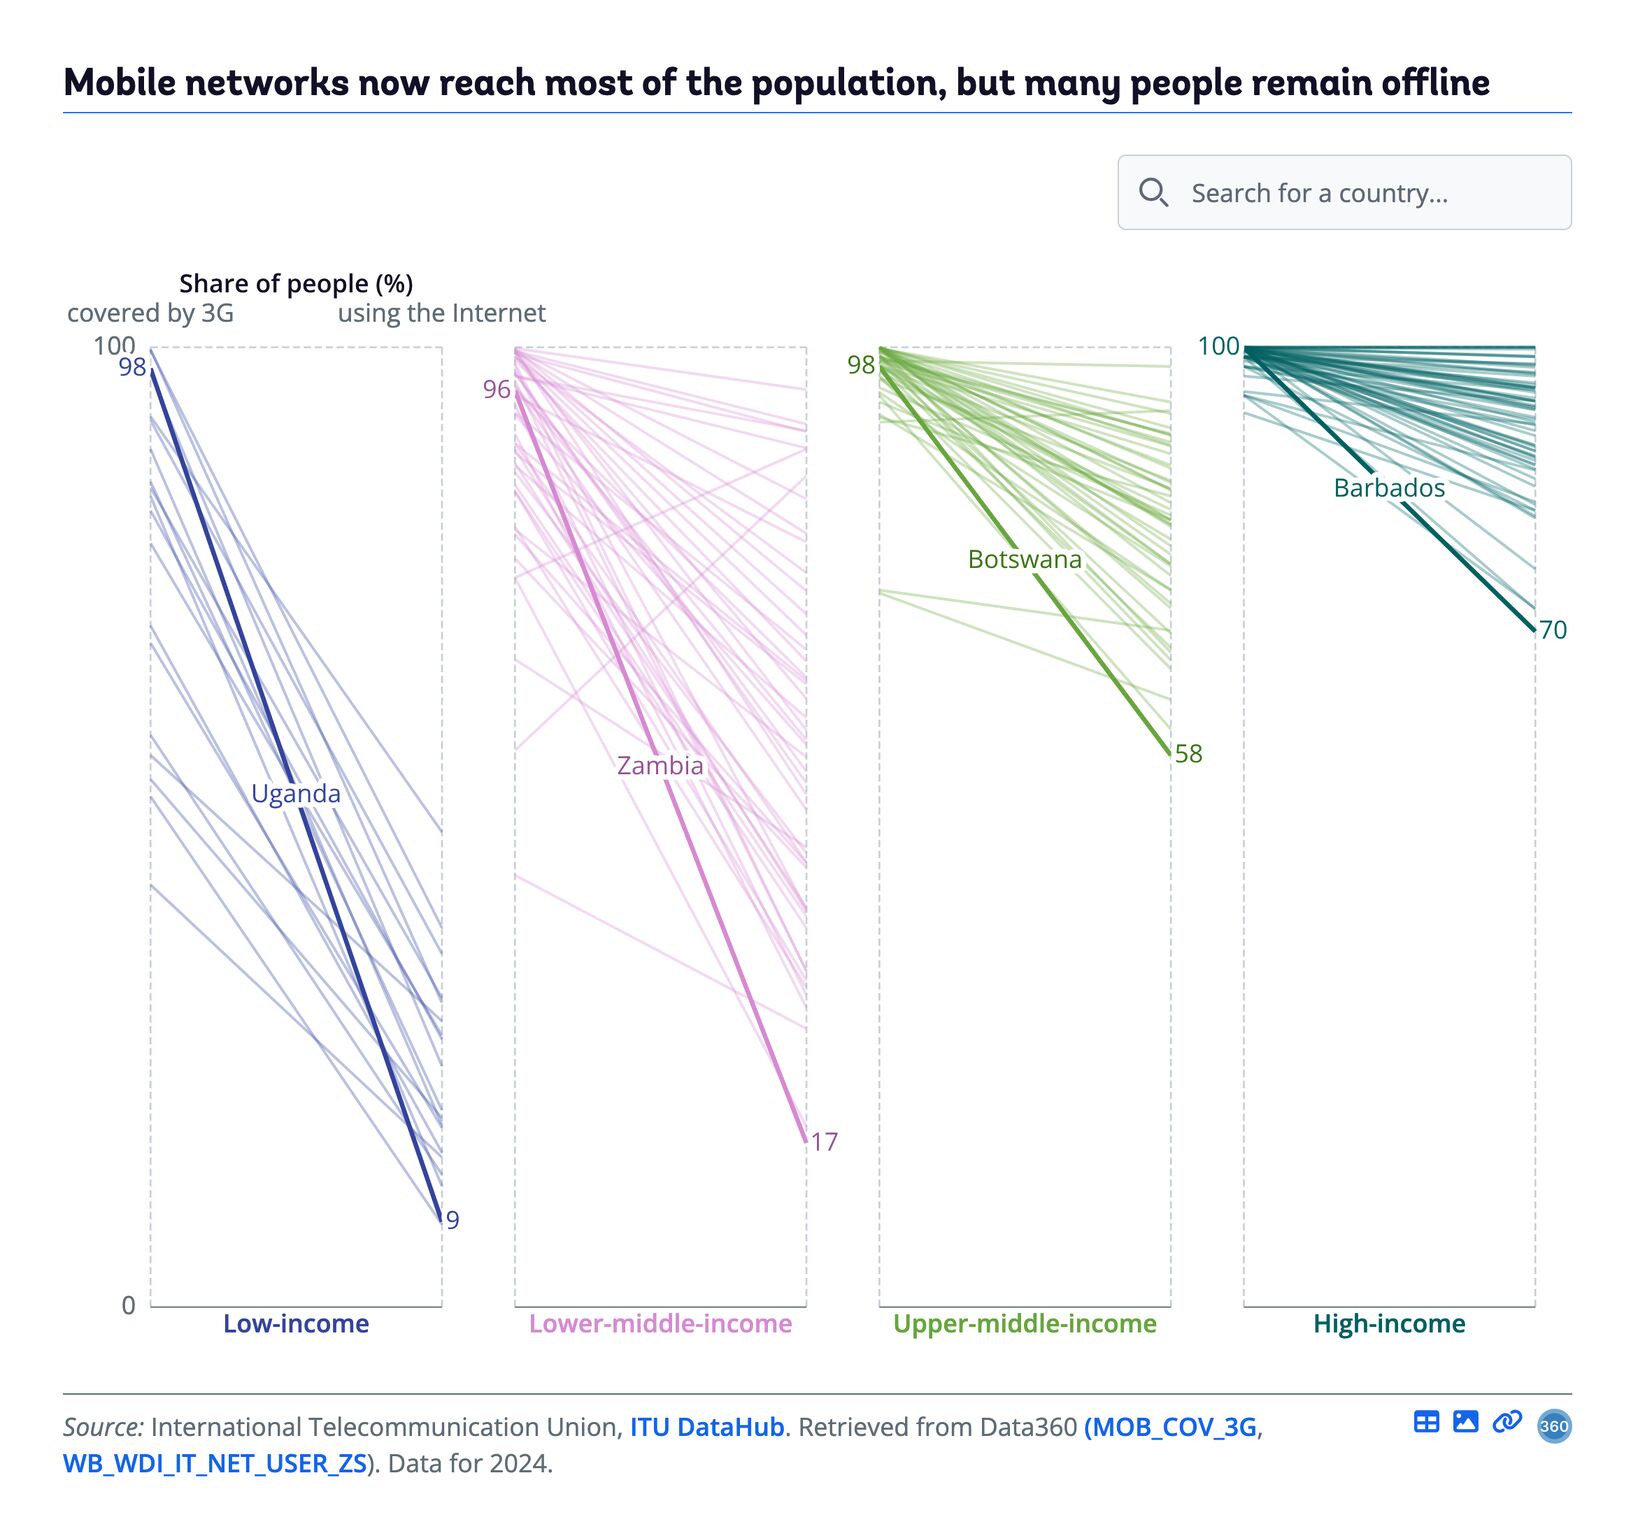
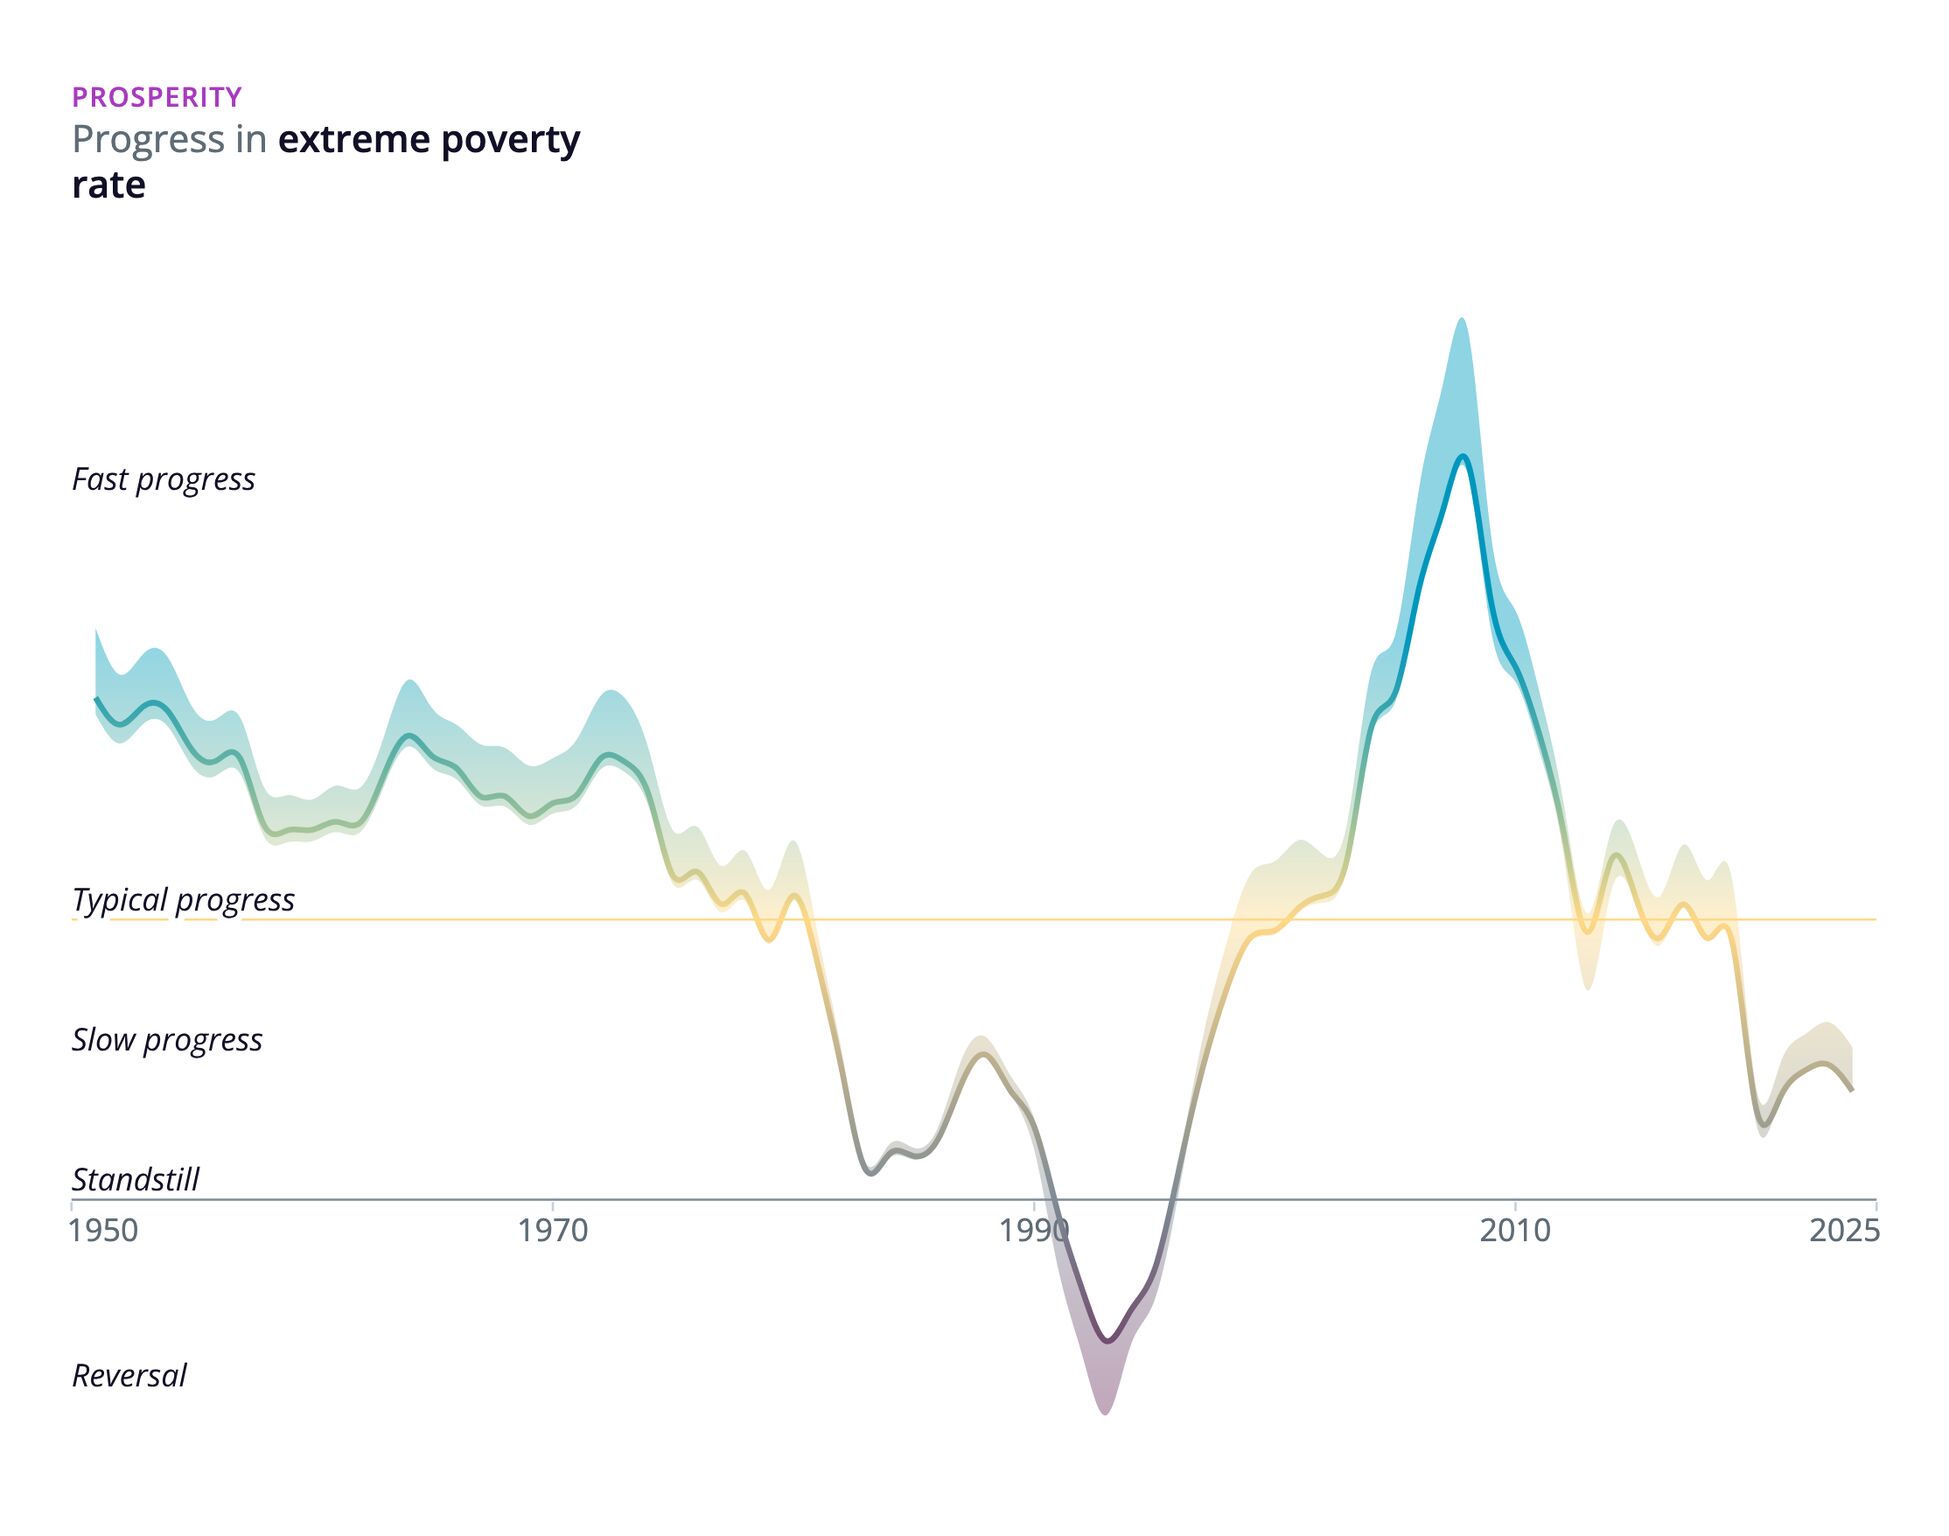
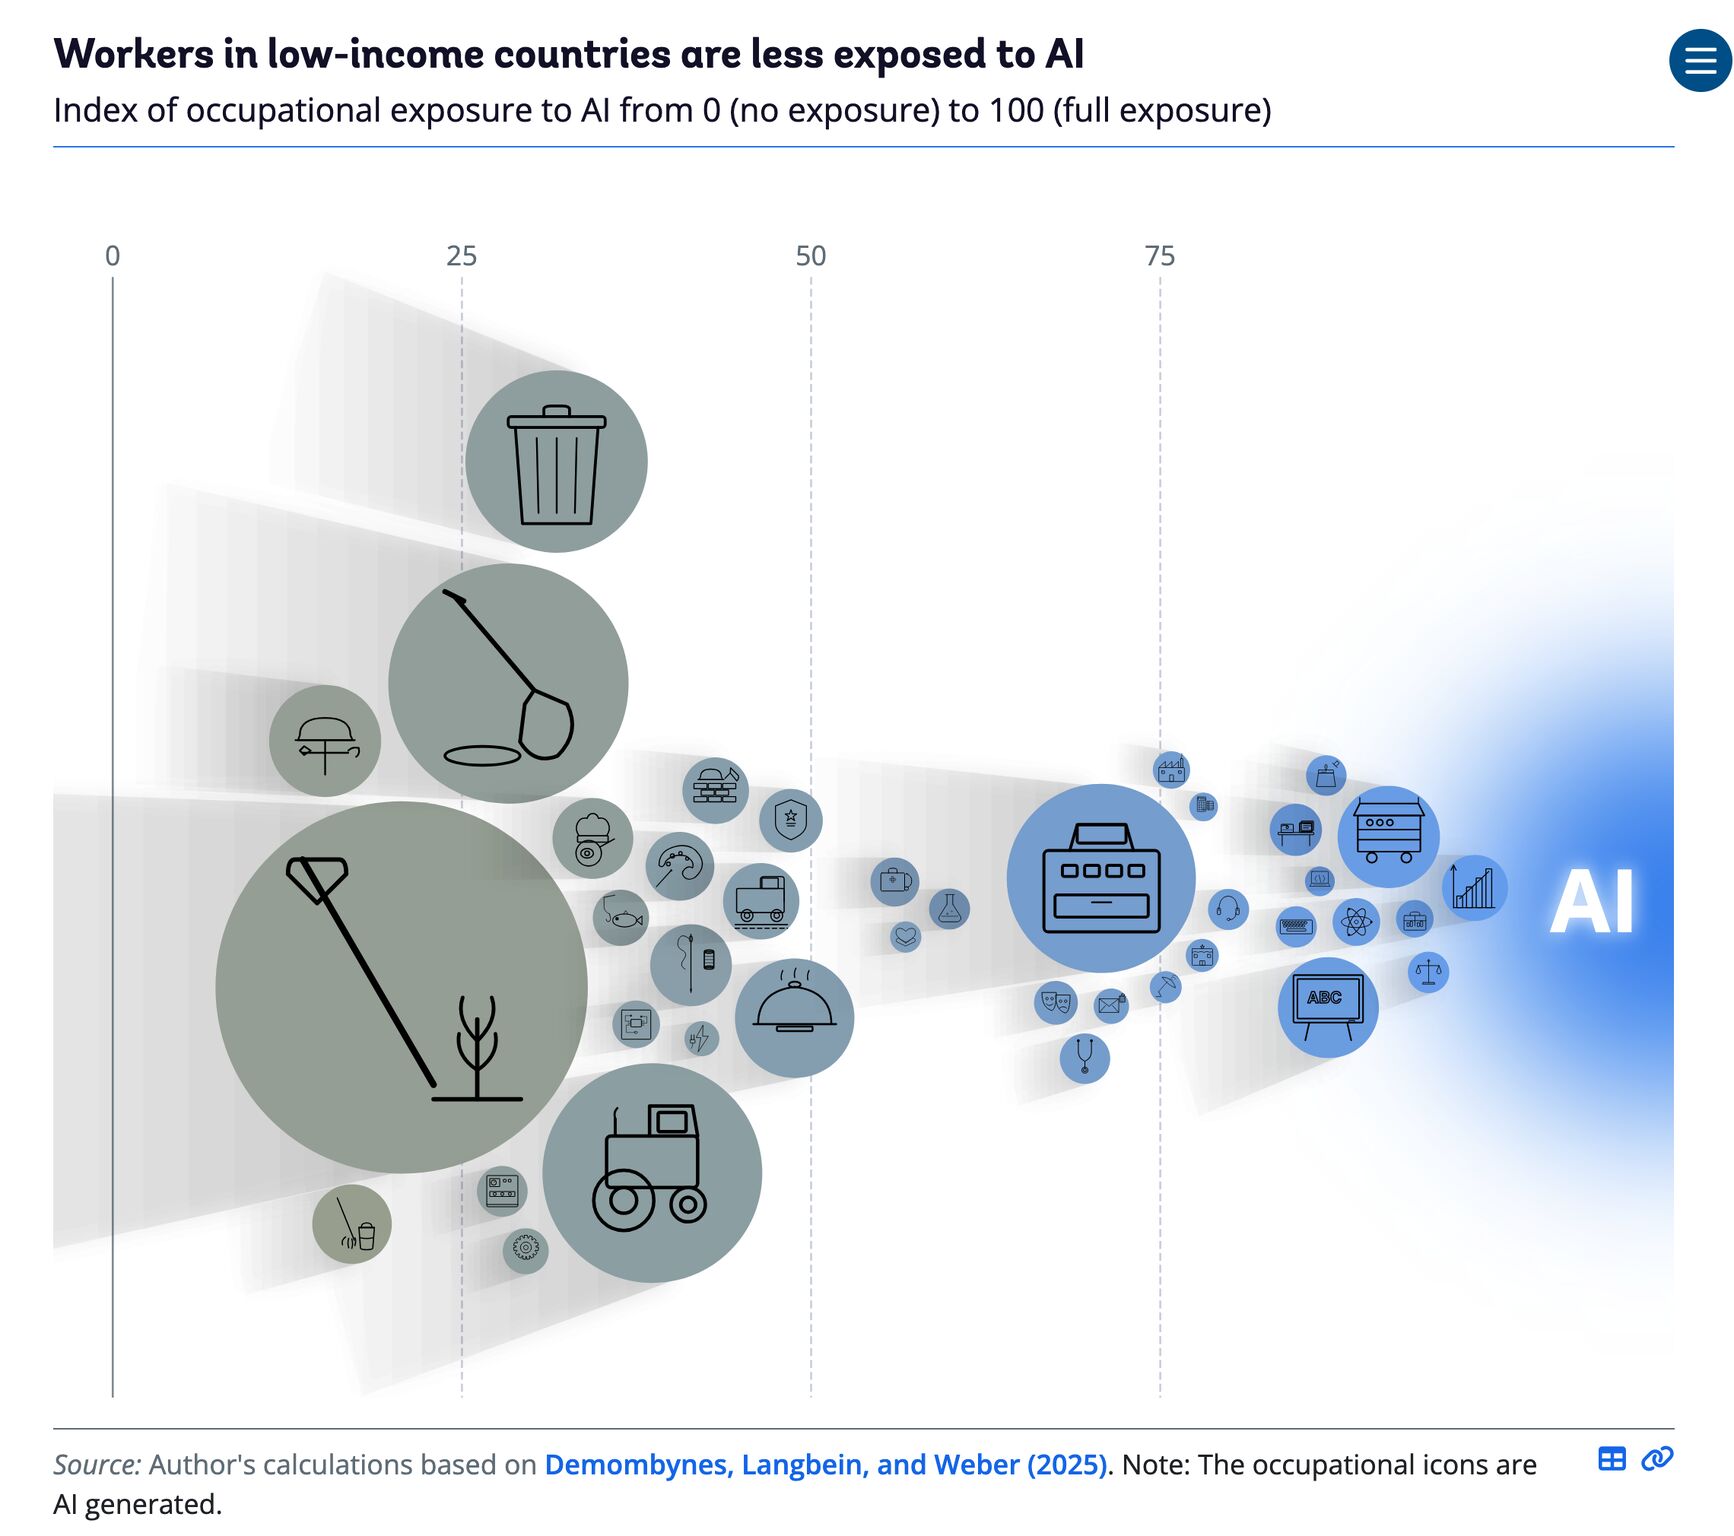
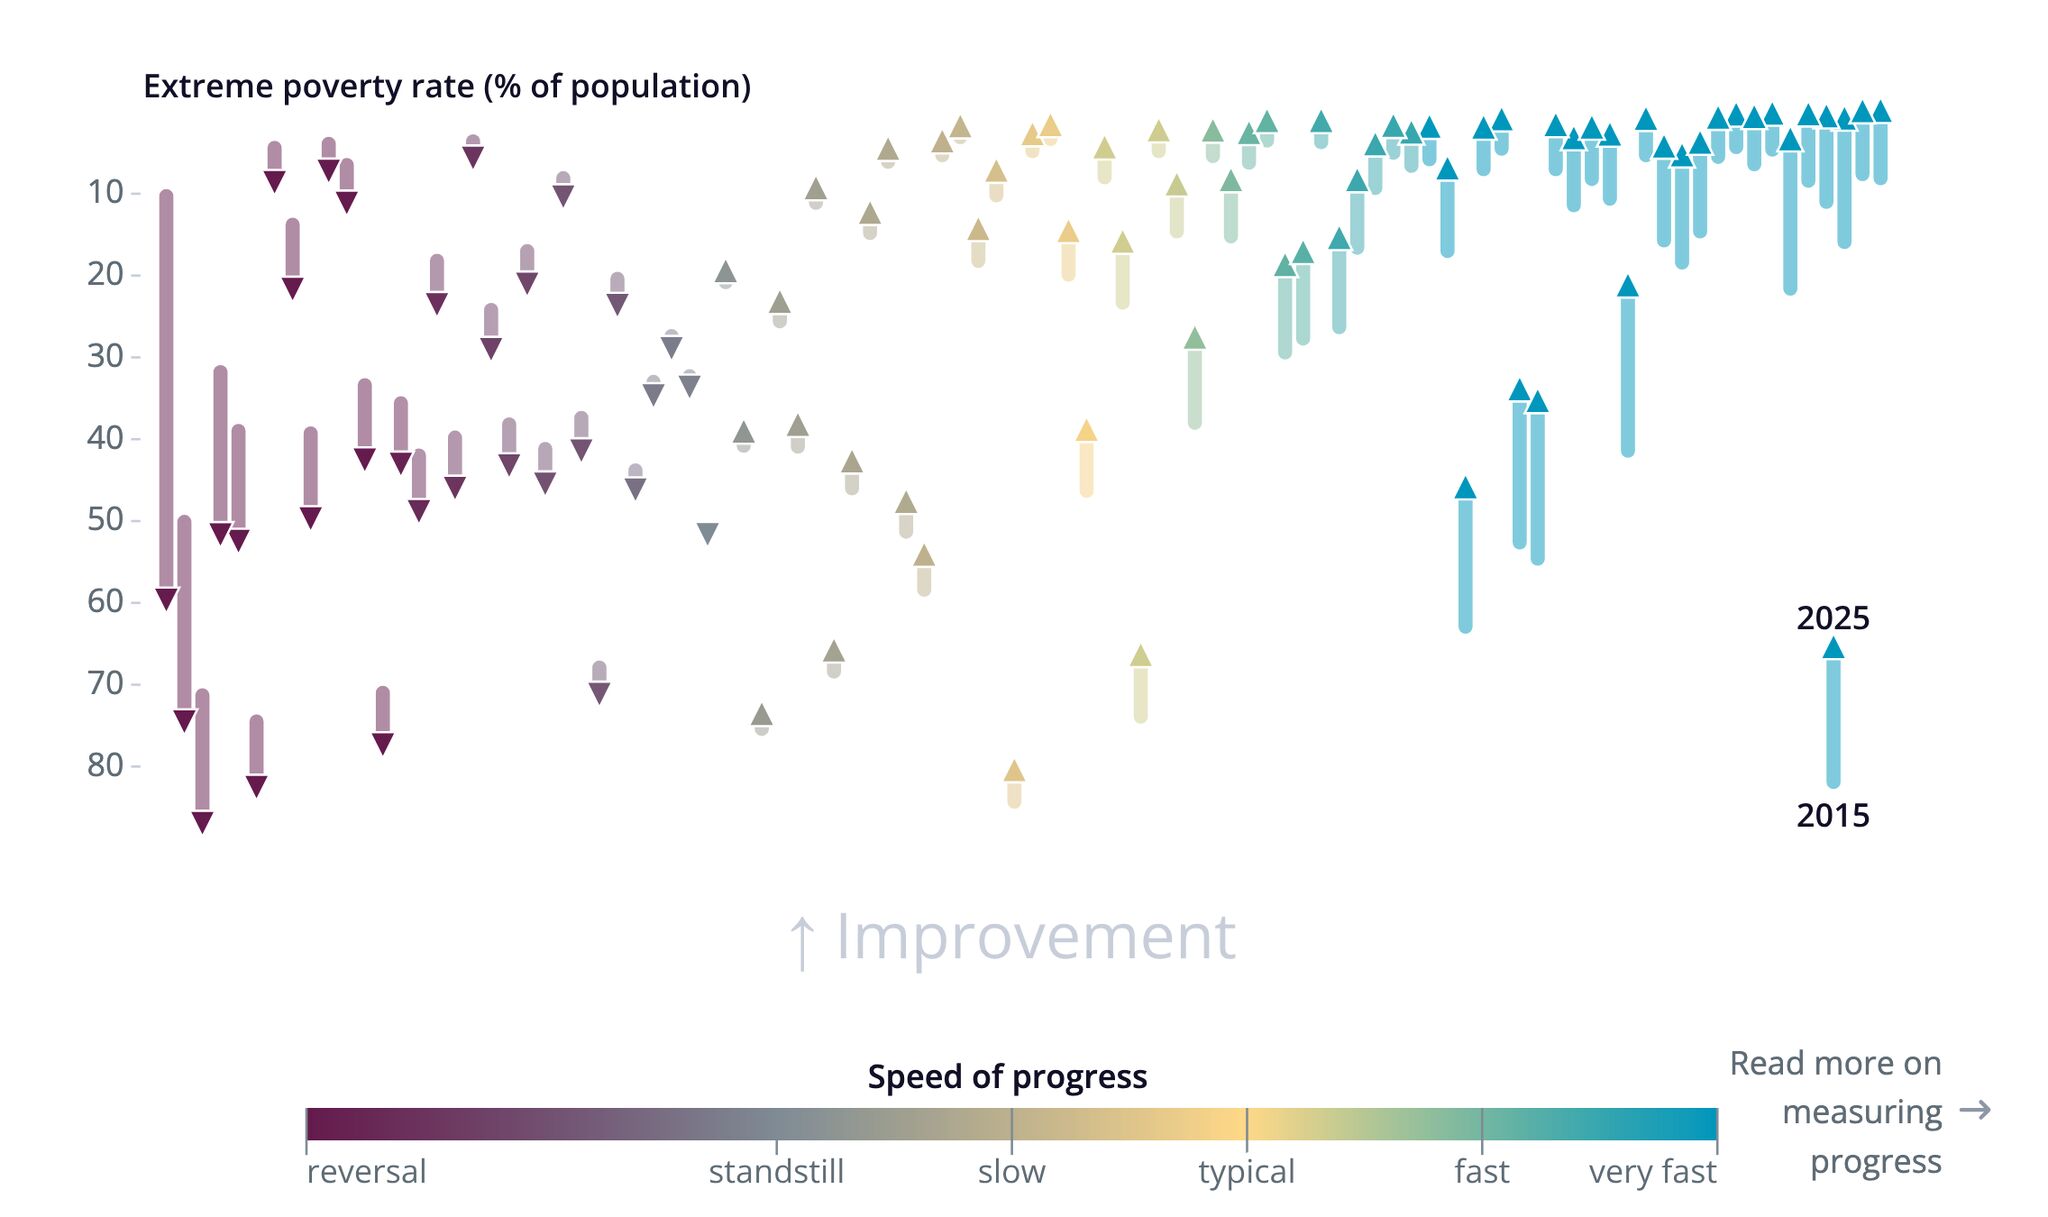
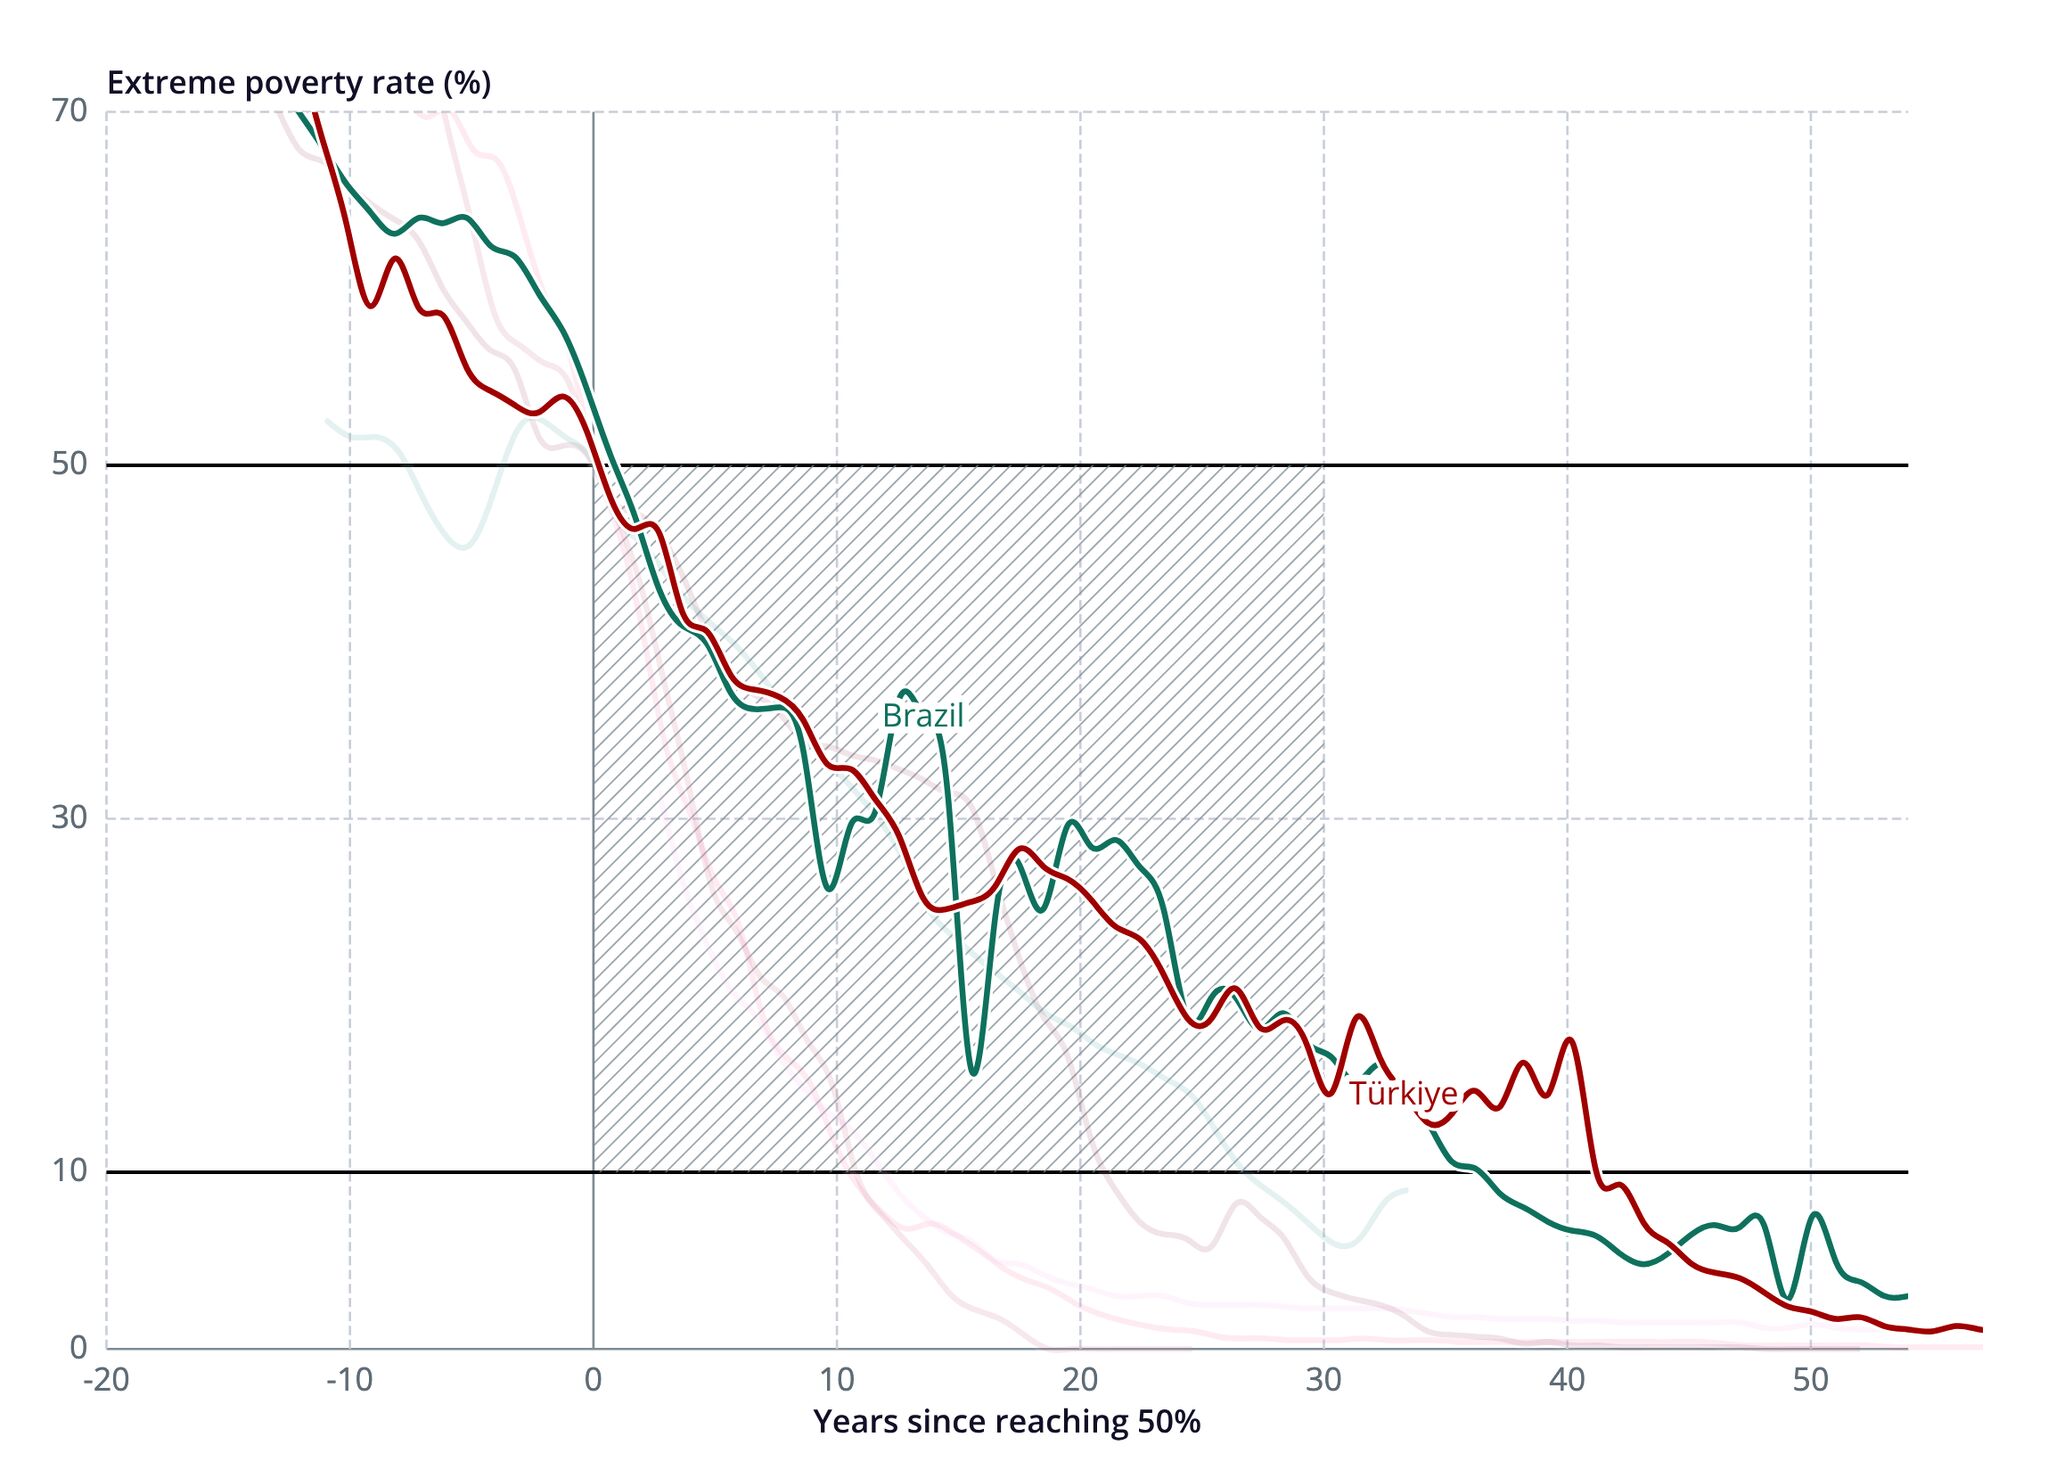
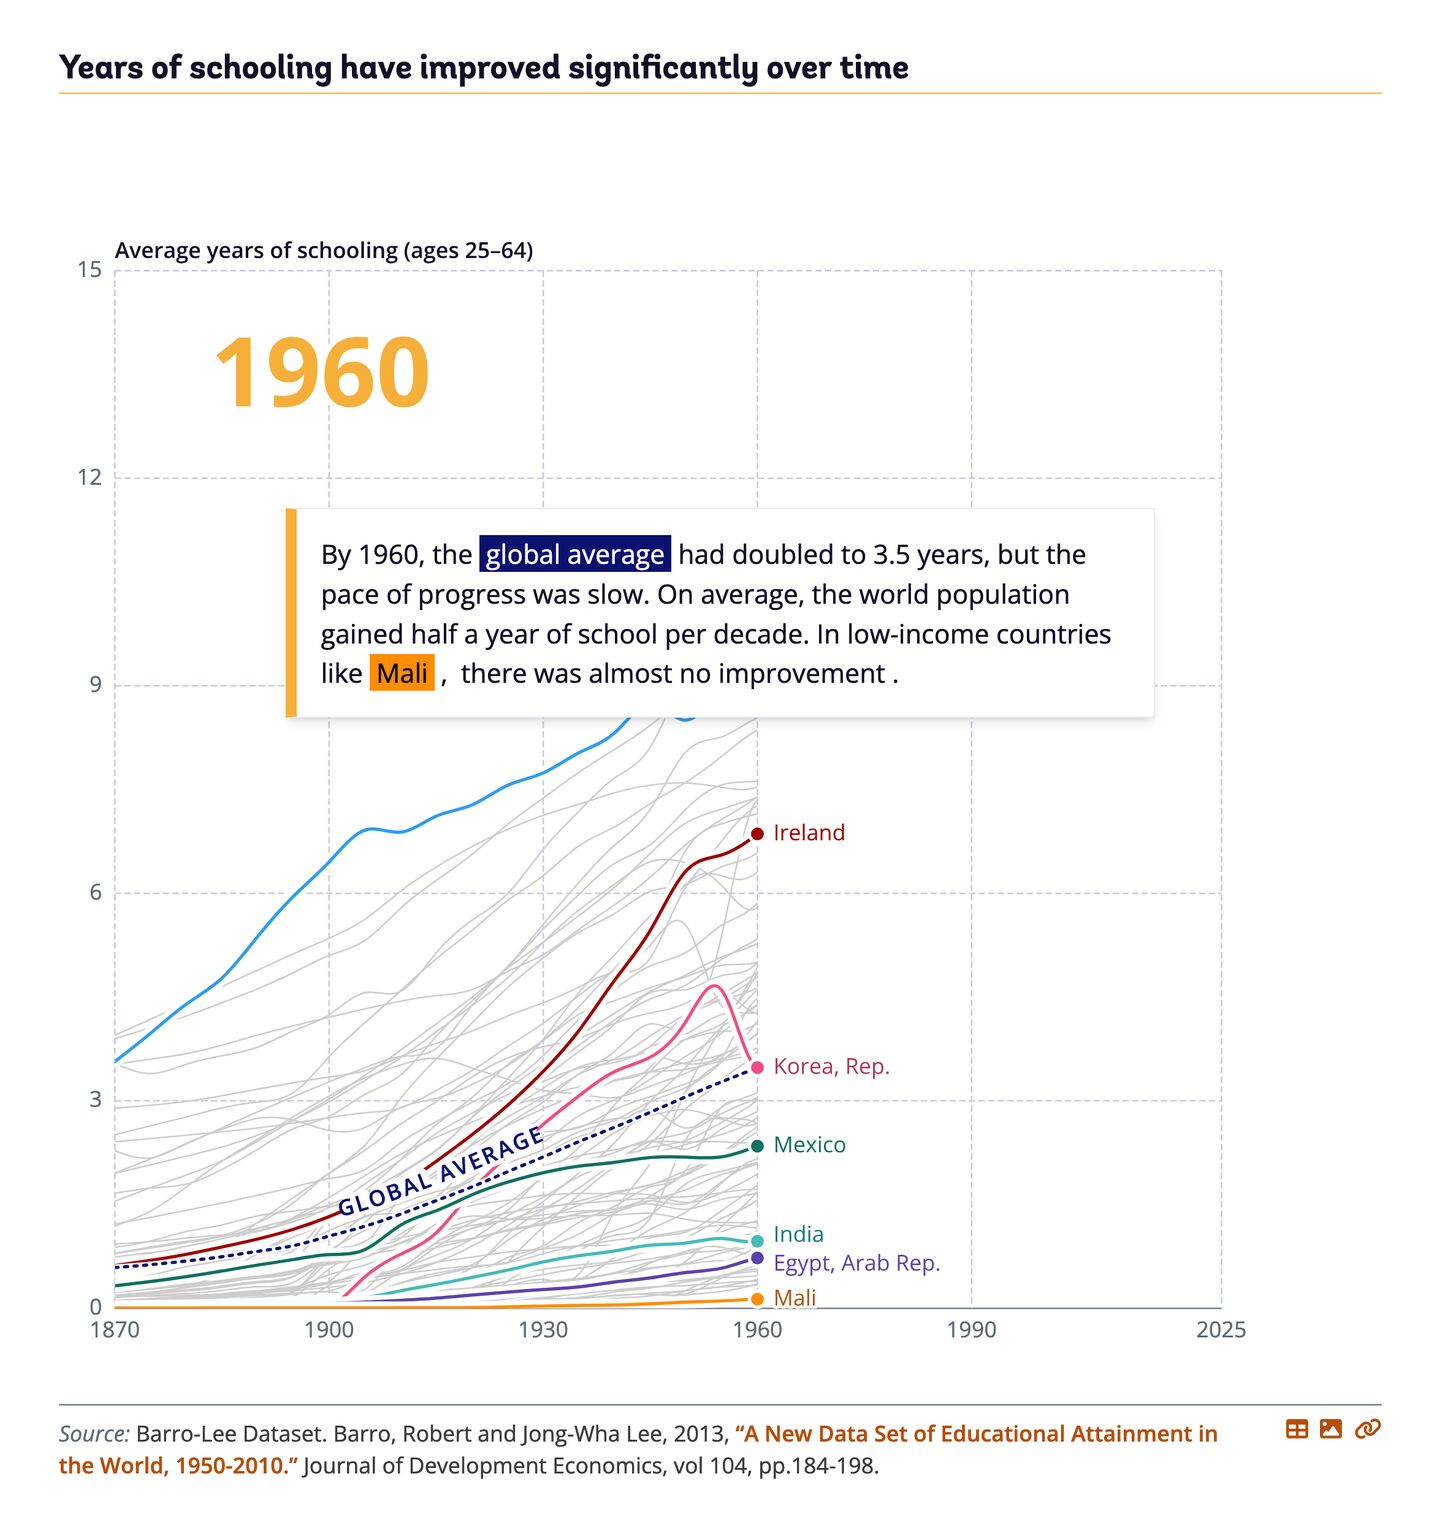
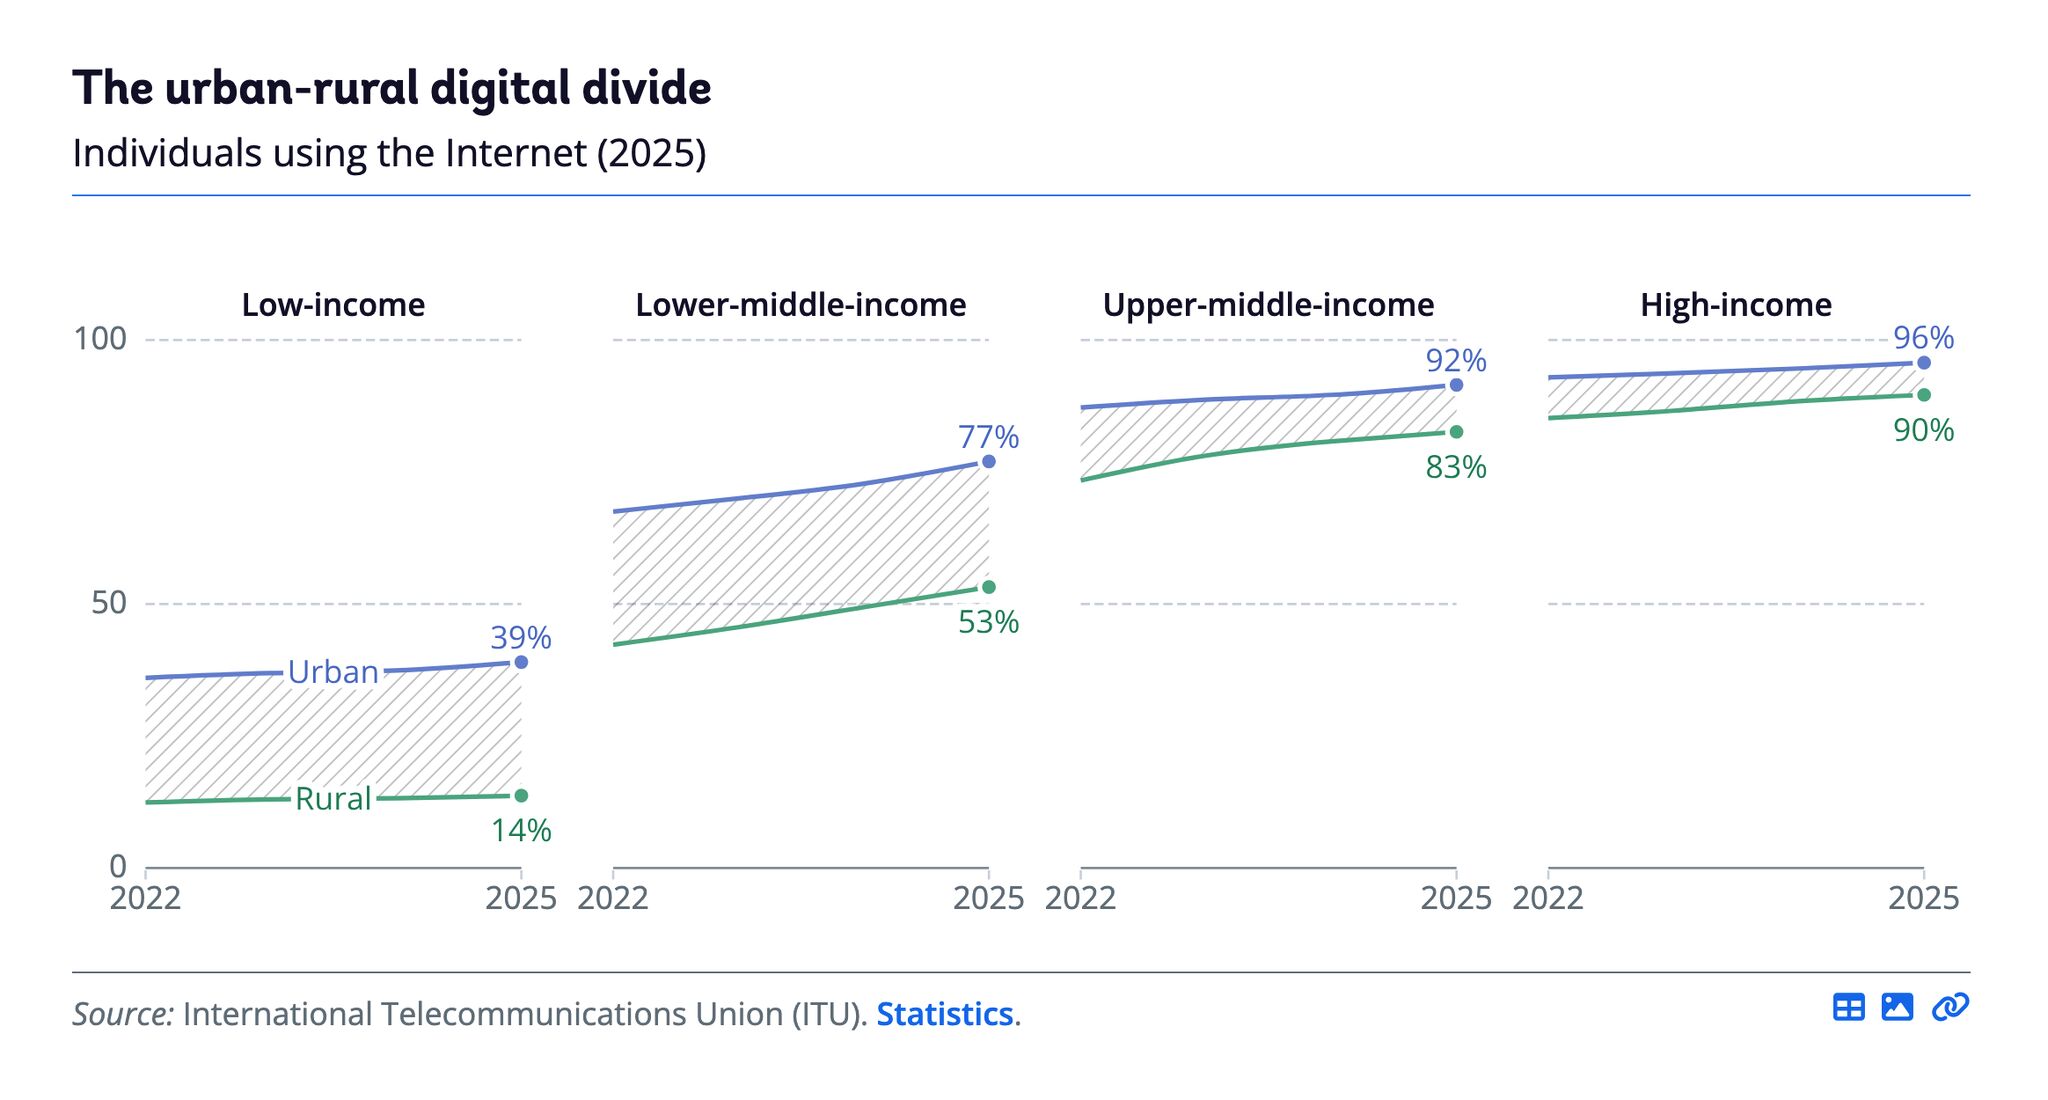
The Atlas of Global Development 2026 dropped last week, and like always, it’s a visual feast.
Astonishing data (showing that global development is moving more slowly than it has in 75 years), turned into smart visualizations by Alice Thudt, Jan Willem Tulp, Christian Laesser, Ændra Rininsland, Maarten Lambrechts, Dominikus Baur.
Come for the charts (above are some of my favorites in random order), stay for the great scrollytelling explanations that always go a bit deeper than you’d expect.