
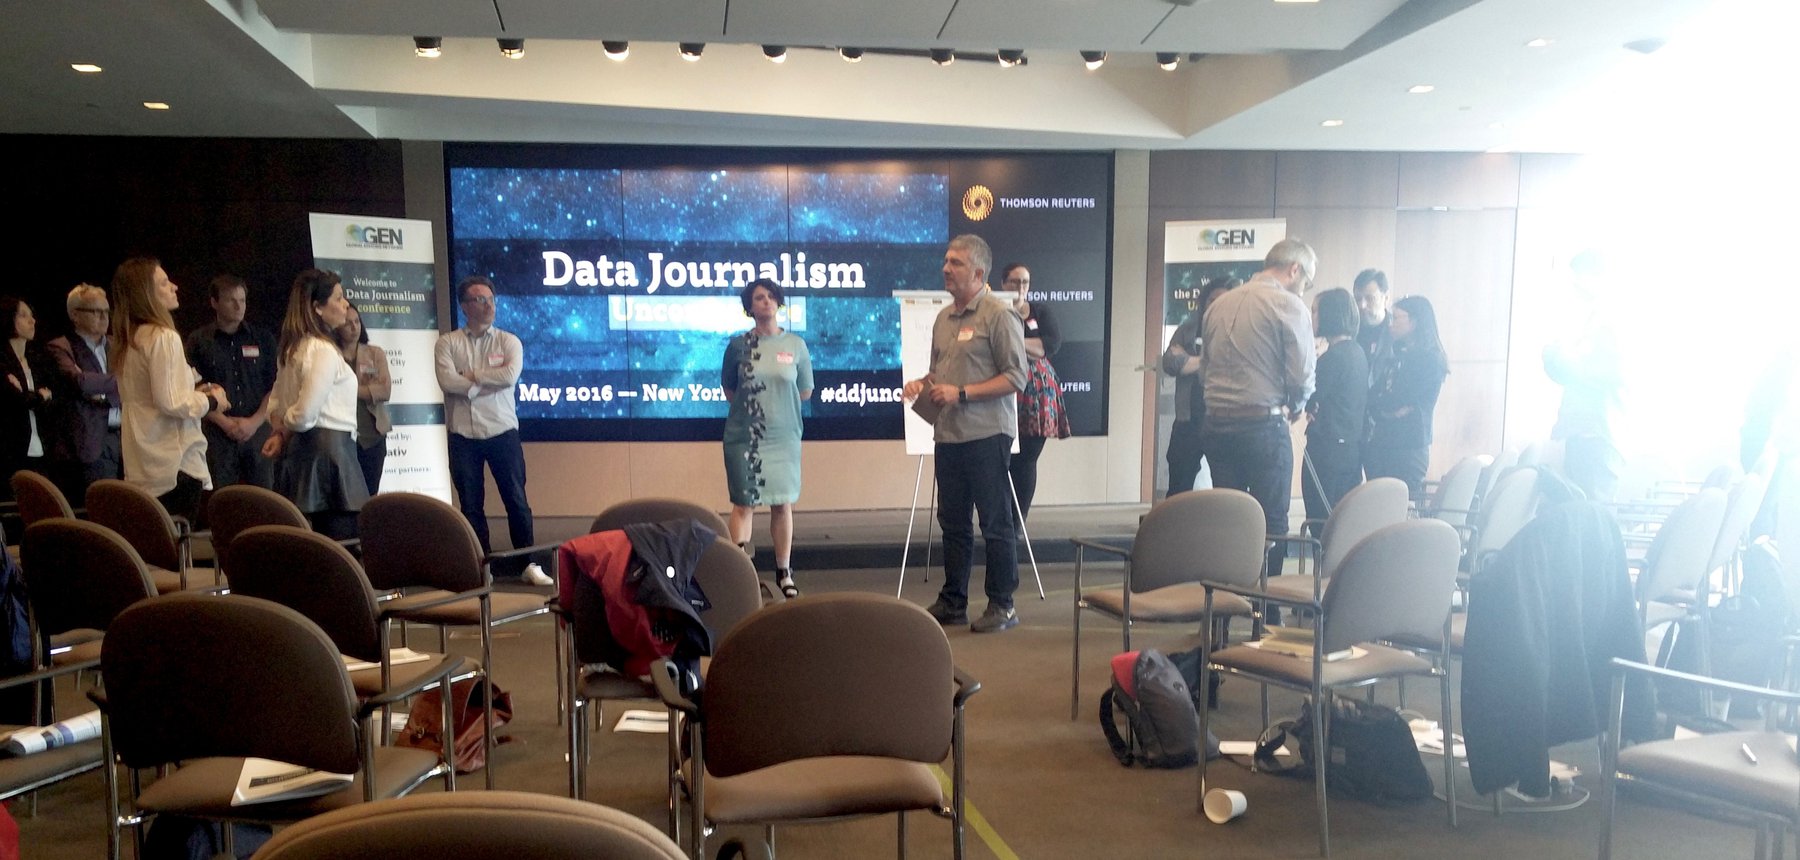
What a great, great day today. I’m still in New York City, and I’m so glad I went to the Data Journalism Unconference today! Really good. Short opinion about the whole thing: Unconferences (aka one facilitates discussions instead of giving talk) are awesome and work really well, but this part happened only for roughly 2.5 hours. The rest of the time was a “normal” conference and seemed a little bit unstructured. I felt like they tried to punch a lot of ideas into the schedule (”let’s do unconference! Also, a panel discussion! Also, the sponsors should talk! Also, we present the shortlist of our award! Also, let’s have some design thinking session for everyone!”) (it’s the first time they’re organising this conference).
But like every conference, the people are more important than the schedule. And the people were GREAT. There were between 50 and 100 of them, which is a good number of attendees: Big enough to meet lots of interesting people, small enough to speak to everybody you want to speak and to bump into each other a lot during the span of a day. I spoke to so many great people: Scott Klein, Jonathan Stray, Pete Bale; Dan Sinker was there and my great fellow fellow Pietro; I learned about the data vis team structure at the Wall Street Journal from Carlos Tovar and talked with Patrick Walsh about Data Science and how to measure impact. Just to name a few. Did I mention that they are great people?
Also, it helped that the event happened on the top floor of the Reuters building with a great view over Times Square.
Also, I facilitated half of a session, which was fun. After Duncan presented his impressive looking new tool “Flourish”, I moderated a 40min-conversation about tools everybody used in their newsrooms and put the names of the tools in a long list. Some people told me afterwards that it helped them just to hear about new tools, but in the best case I would have loved to have a deeper conversation about: How do you learn new tools? Which tools are great for beginners? What are the benefits of tools vs. languages? How can we teach each other tools? How can we teach editors tools? etc. I think we mentioned at least all of these problems, but I think a slightly smaller group of people would have been more productive in such a conversations than the big one we were. The most interesting point raised, in my opinion, was the question: “Why do we separate between tools for analyzing data and tools for presenting data? Why do we use R AND d3? Why Python AND Highcharts? etc.”
Oh, and afterwards my fellow fellow Dan and Pietro and I watched a movie. Captain America. It was pretty bad. But I haven’t been to a cinema in a long time, and just sitting in front of a big screen made me very happy.
Input? 10
Output? 6
Learnings?
The Wall Street Journal has a “mini”-Visuals Team for every section. Meaning, there is one data vis person (and one or two photo people etc.) sitting in every section (like markets, national etc.) of the newsroom. If you ask which kind of solution Journalism (or specific articles) offer, then it’s always “transparency”. Journalism uncovers what’s hidden from the public or things the public doesn’t have a good overview of. If transparency wouldn’t help to get to your goal, then don’t try to solve it with applying journalism to the problem (aka writing about it).
When we report on a problem in our city or area or country, we report on a local minimum/maximum. But the global minimum, in another location, might be so much bigger - and they might even be not aware of the fact that it is a global minimum.
Your content doesn’t matter if it reaches 1 million people but only 1% of these people are the people you want to reach. And if you only reach 1% of the people you actually want to reach. Tableau Public aggregates data to create its chart. So even if you can’t export the data, you can just copy and paste the created data table and copy it into a chart builder tool of your choice.
The size of a data vis team is not everything. A team can be important in the scene because its members put themselves out there, through blogging, social media, conferences, podcasts.
Questions?
Which parts of data science are editors and data journalists use in newsrooms? What are the most important statistics skills you should have as a journalist?
How do people share skills and knowledge between newsrooms?
How did (data) journalists move, from newsroom to newsrooms? I kind of want to see a data visualisation on that. Or create a own one.
Ask yourself: Which decisions are you going to make as the result of your impact evaluation?