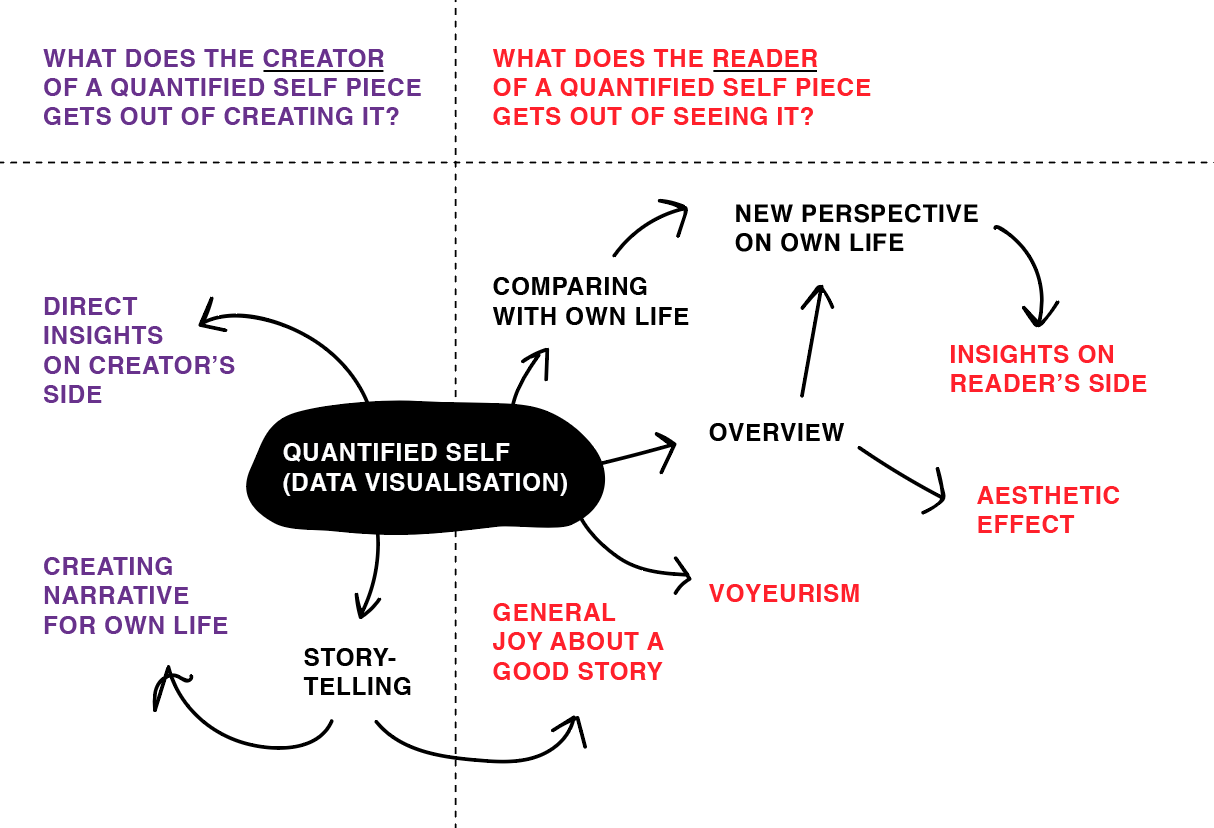
Today was another one of these “lots of little stuff” days. I helped somebody from the German government who wanted to create my d3.js unemployment chart from 2 years ago with Excel; I was in a meeting about a new story and in a meeting where Katie shared her learnings from an the school funding project; and I finally figured out the point of quantified self (pic above). I was thinking about on and off since last fall.
My main task today was getting my blog post draft so much done that I could send it to Lindsay who will - and I appreciate that a lot - give me some feedback about it. My second main task was scraping some stuff from the internet, again. Yeah! I like scraping.
Input? 3
Output? 4
Learnings?
Data Vis is so much better than I thought it is.
Some American children apparently would set an alarm to watch Saturday cartoons.
School funding in America is based on property taxes, which leads to a viscous circle of poor districts having less money for the schools and offering worse education.
Uber prices differ in different cities.
Questions?
Are my learnings in the field of data vis change the way I do data vis?