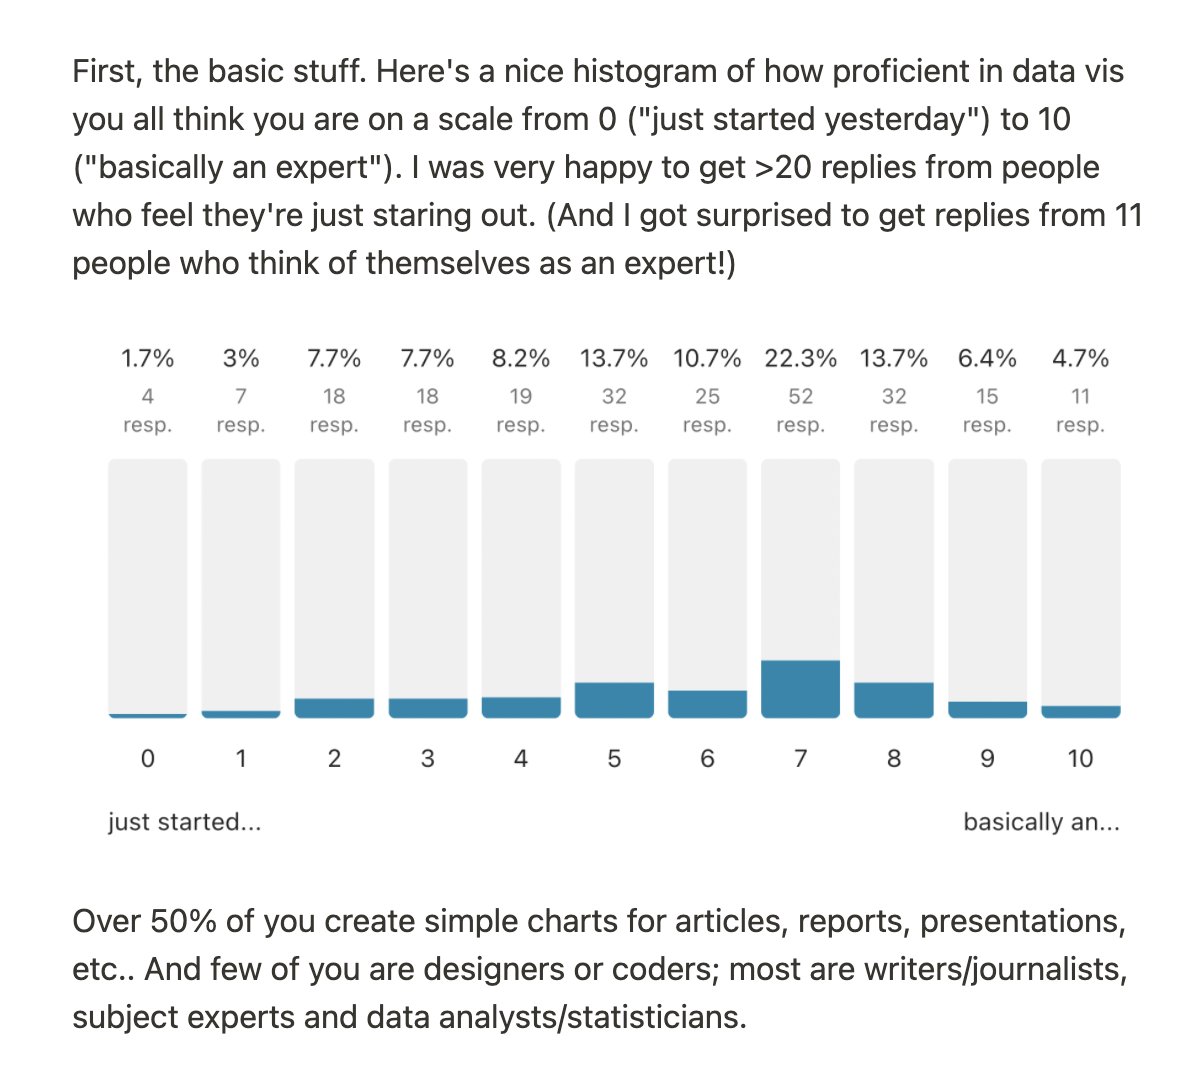
Woah – more than 230(!) of you participated in that little survey. I read every one of your thoughts. Lots of them are super helpful; thank you! Here I analyzed your answers a bit: x.com/lisacmuth/stat…
Likes: 52 | Retweets: 2
Visual data journalist @baskerhel describes a day of working for The Economist in their newsletter Off the Charts – and it’s fascinating: view.e.economist.com/?qs=8bd0940a08… Now I want to read the “typical days” of all good data vis designers out there.
Likes: 60 | Retweets: 9