Today was a really good day. I spoke to two people who responded to the color survey; one from Singapore and a cartographer from the U.S. These were both really interesting interviews – I learned that 30min is very little time to interview somebody, but I don’t want to take away more of their time, and it’s been insightful anyway. Two things I learned:
- In the best case, the color book will help people get better at colors – but it should also give them the terms and the arguments to discuss and advocate for color decisions. That’s something I haven’t really thought about yet…I wanted to keep the book almost “complicated-terms-free”, but I now understand that I must include them somehow.
- I should talk about transparency/opacity and a good use of pattern somehow. Thing is, I have very little experience with them…I very rarely use them. (You know good examples of opacity and pattern in data vis, or good articles about them? Send them this way → lisa@datawrapper.de – thanks!)
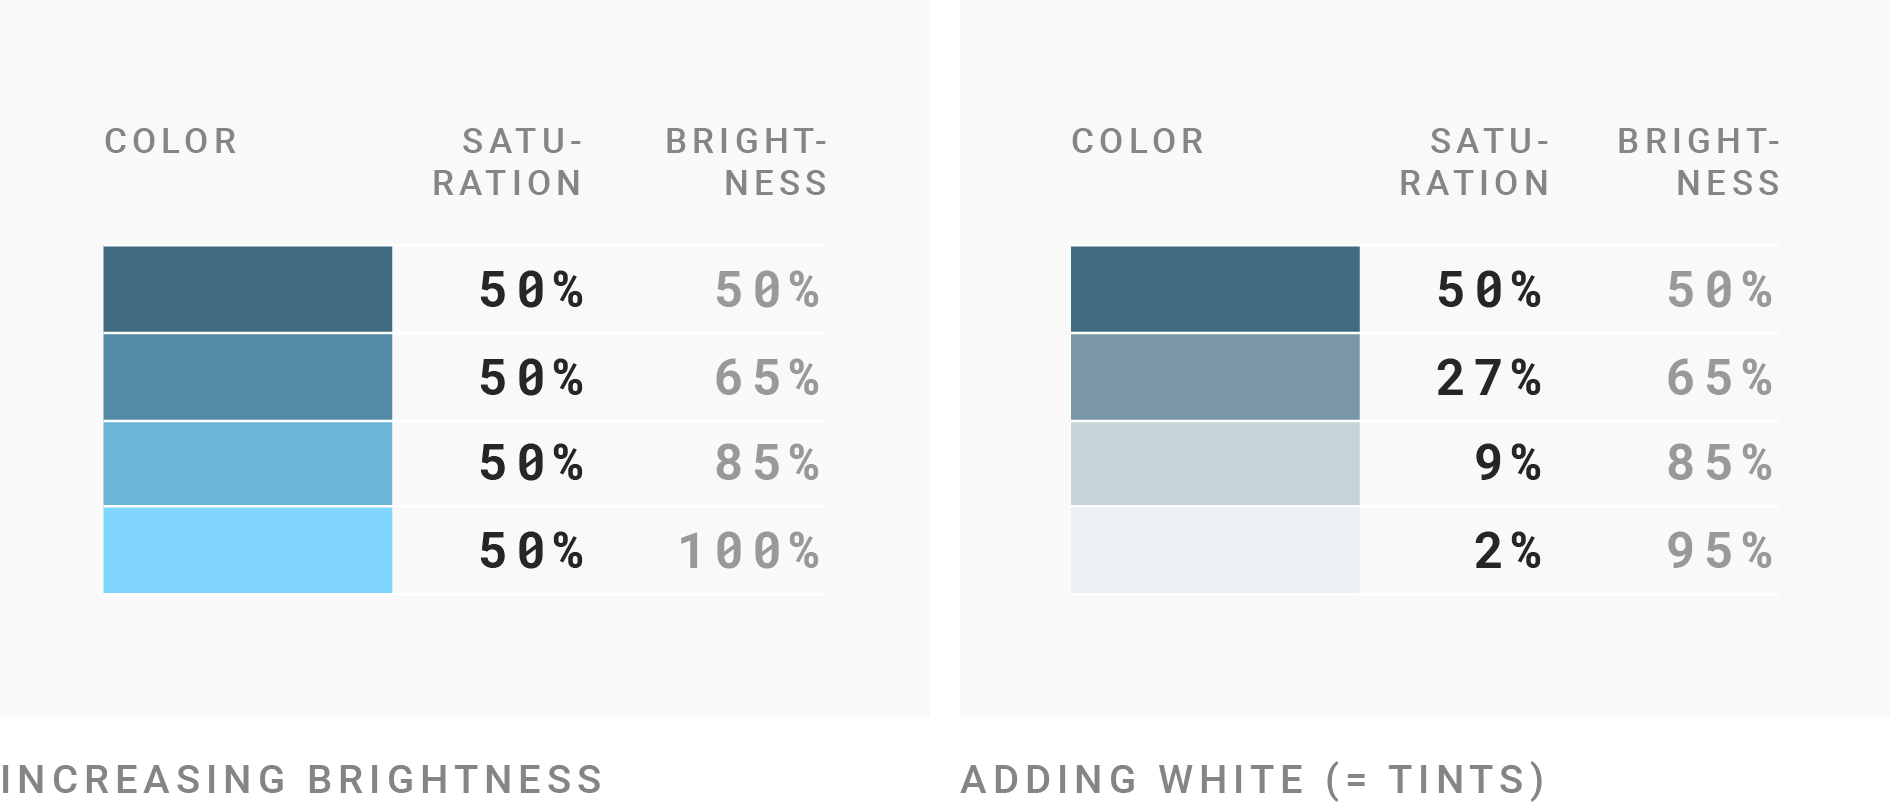
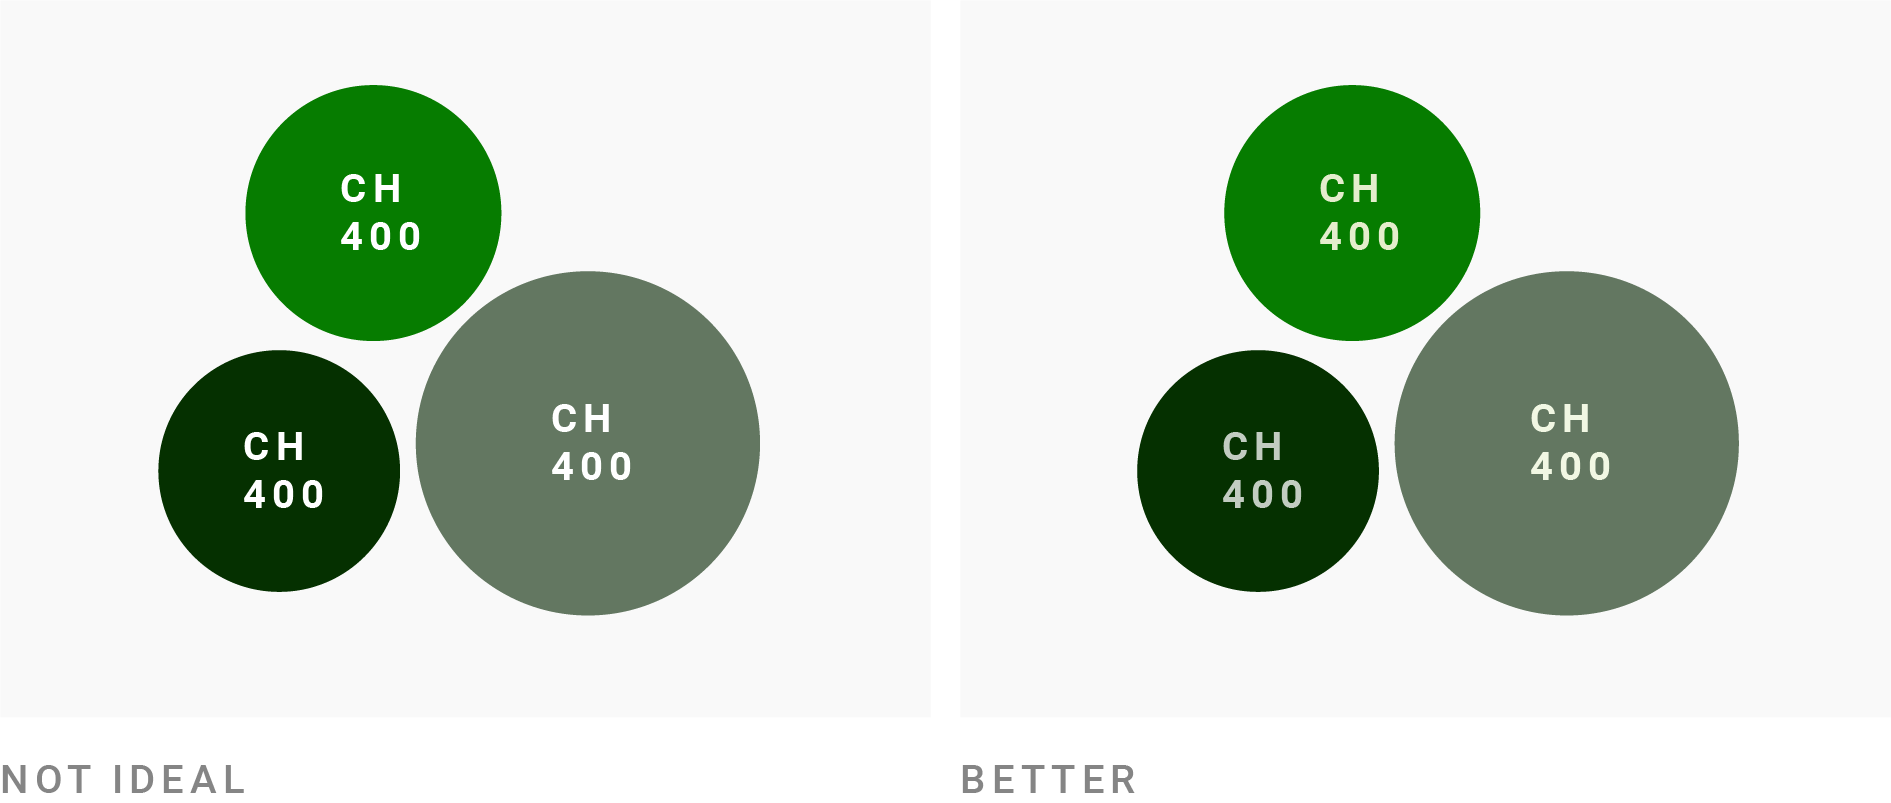
Inspired by the interviews (and by going through notes I made at the end of December), I worked on the book a bit and created a few more illustrations for it, like the one at the top, or this one:
And I read two articles:
- Why color contrast is not as black and white as it seems by Roger Atrill, as a preparation for the blog post on color contrast (that I’ll publish next week!)
- Does Data Visualization Have Rules? Or Is It All Just “It Depends”? by Nick Desbarats. Good article that I (and, as I expect, most others) agree with. It’s something we at Datawrapper have discussed, too.
One more day until we launch this blog and you’ll all learn that it exists! That’s exciting.