
Two more interviews today; both very interesting. After now ten interviews, I thought I would notice more of a “diminishing return” effect – that the later interviewees would result in less interesting insights not because they’re less interesting, but because others before them already gave me these insights – but that’s far less the case than I thought. Which is great! I’ll have three more interviews on Thursday, and then I might do a few more interviews with people who created color palettes for style guides afterwards, for an article I’m writing on that topic.
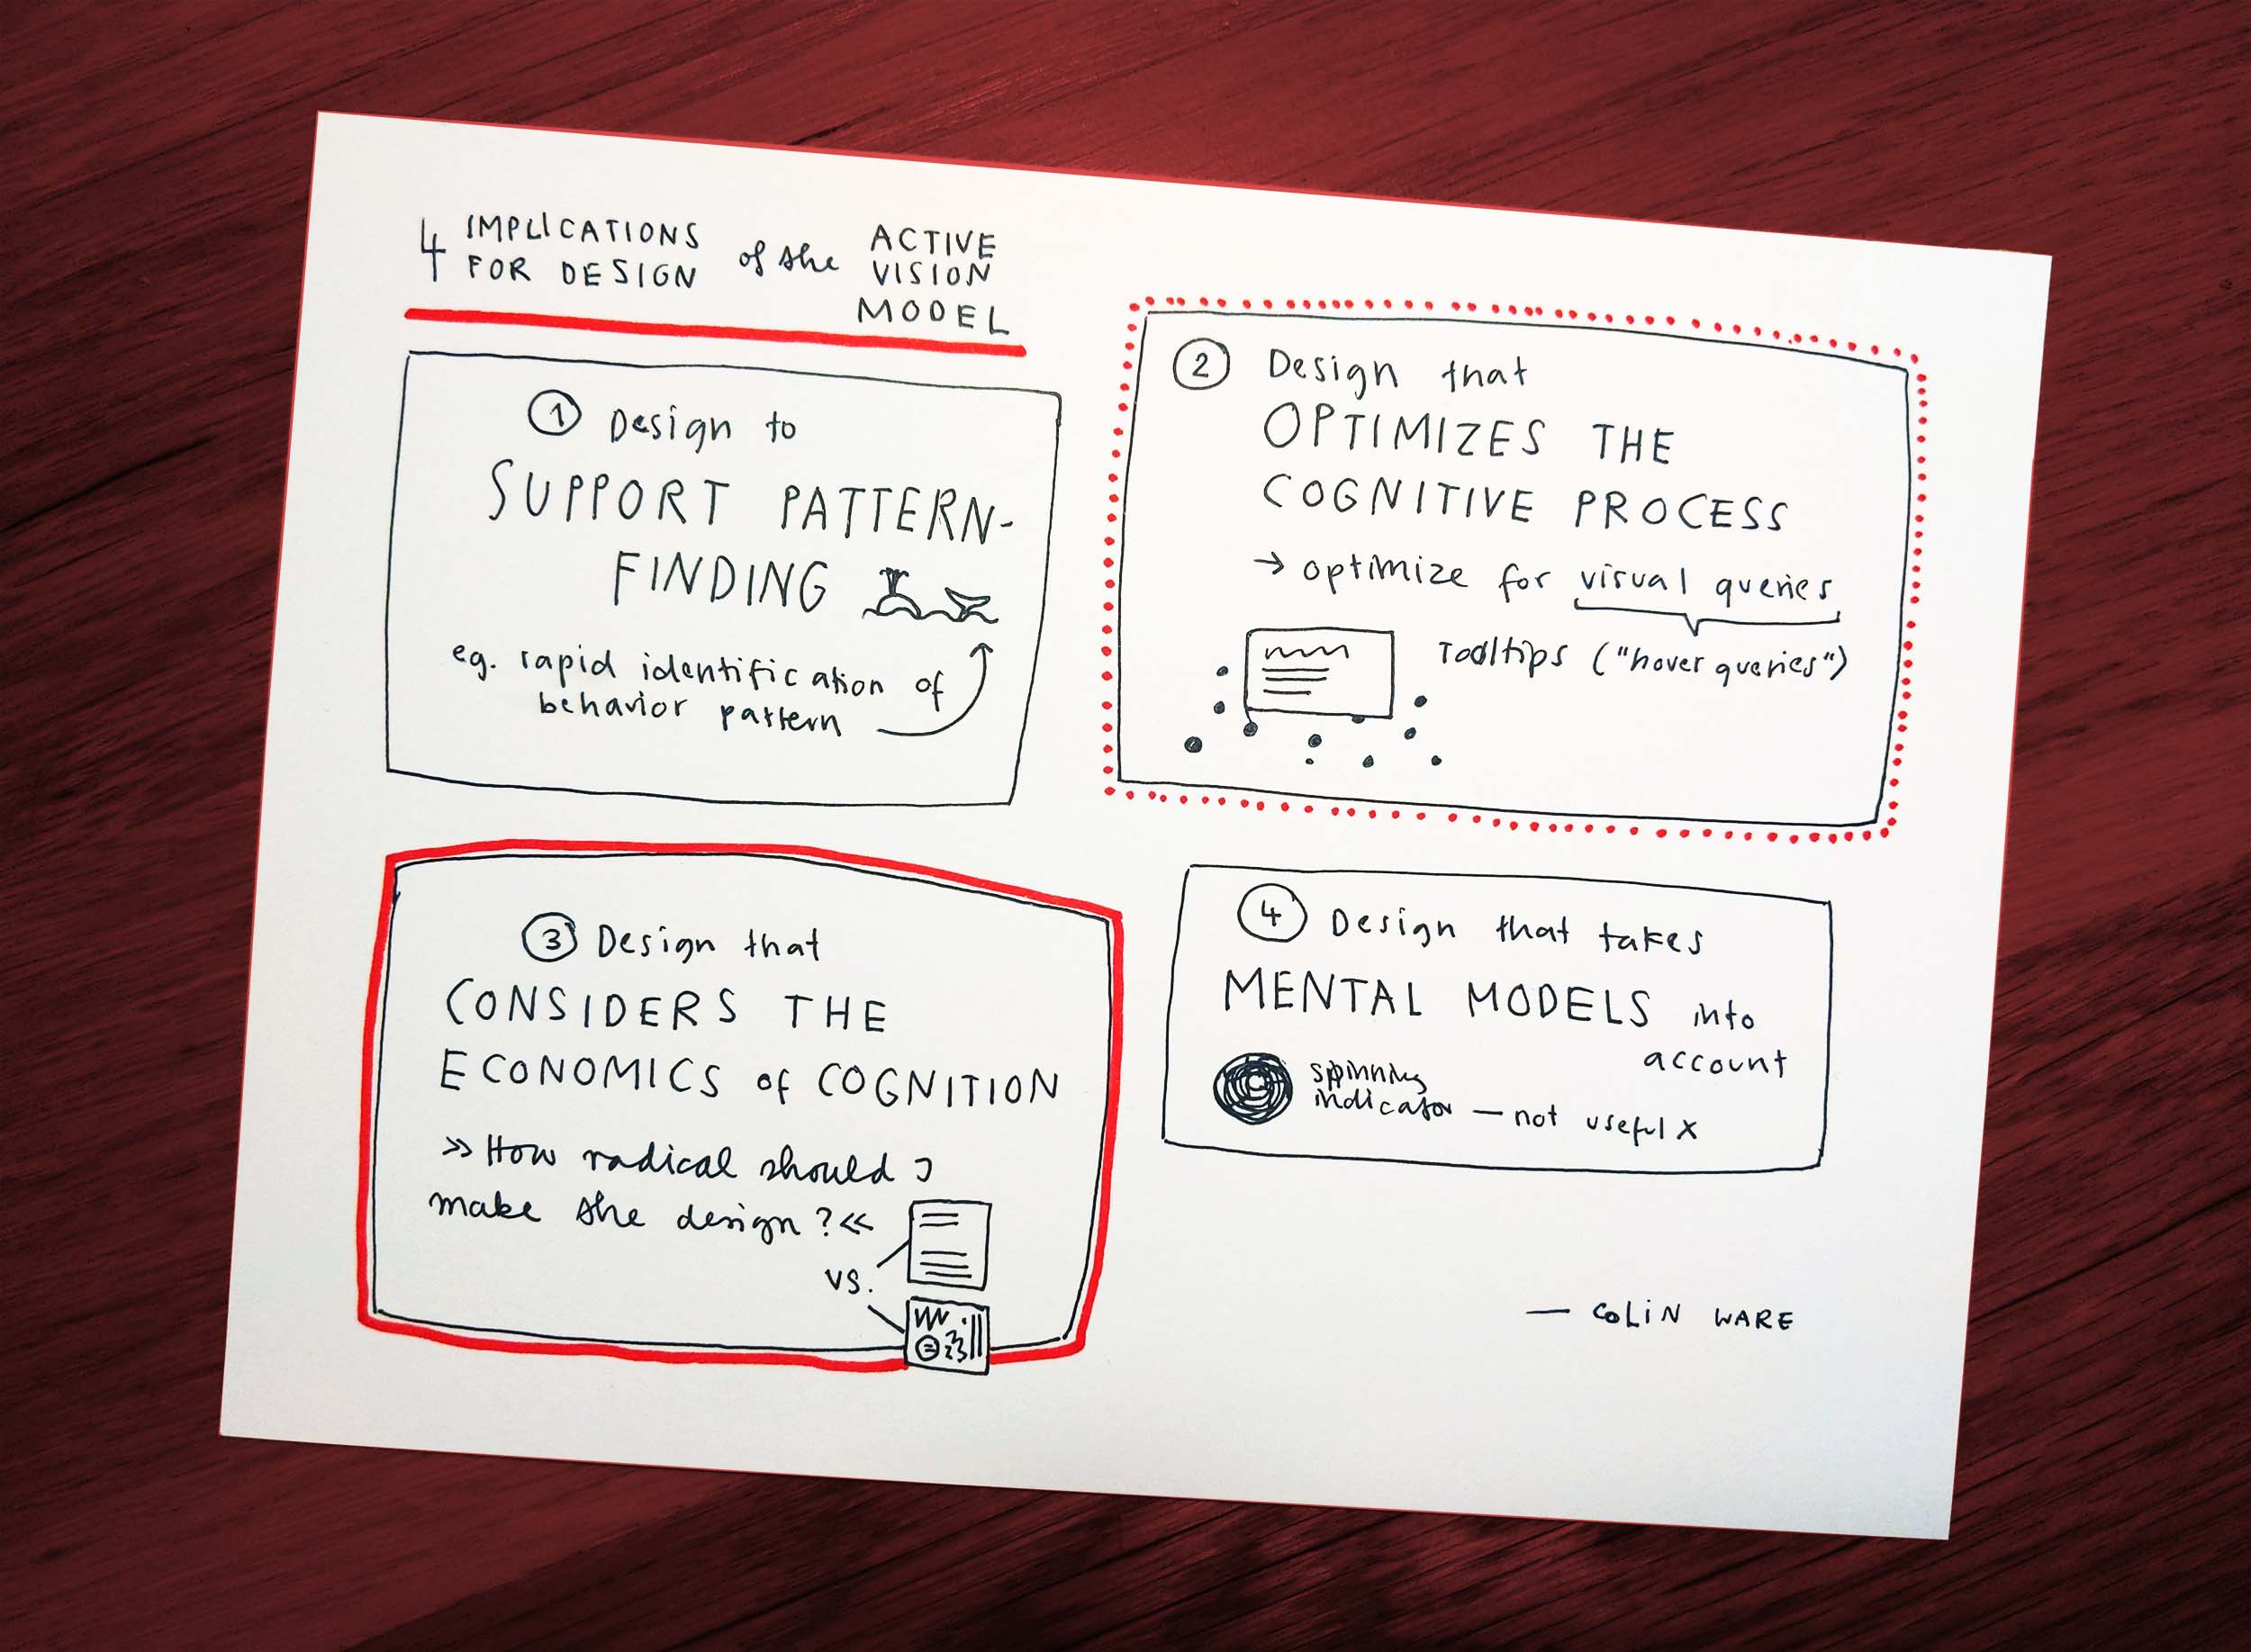
I also finished reading Colin Ware’s “Visual Thinking for Information Design” today, for the book club discussion tomorrow. I documented each of the ten chapters of the book with a little illustration or quote over at the @datavisclub Twitter account. It was kind of stressful on to do that on my two free days Friday and Saturday…because it also took more time to anticipated in general. Not sure I’d do that again 😅.
Anyway – one of the interviewees recommend me Colin Ware’s 2009 paper “Quantitative Texton Sequences for Legible Bivariate Maps” to learn more about how to place patterns on data visualizations….so I won’t be done reading Ware entirely. Looks like an interesting read!
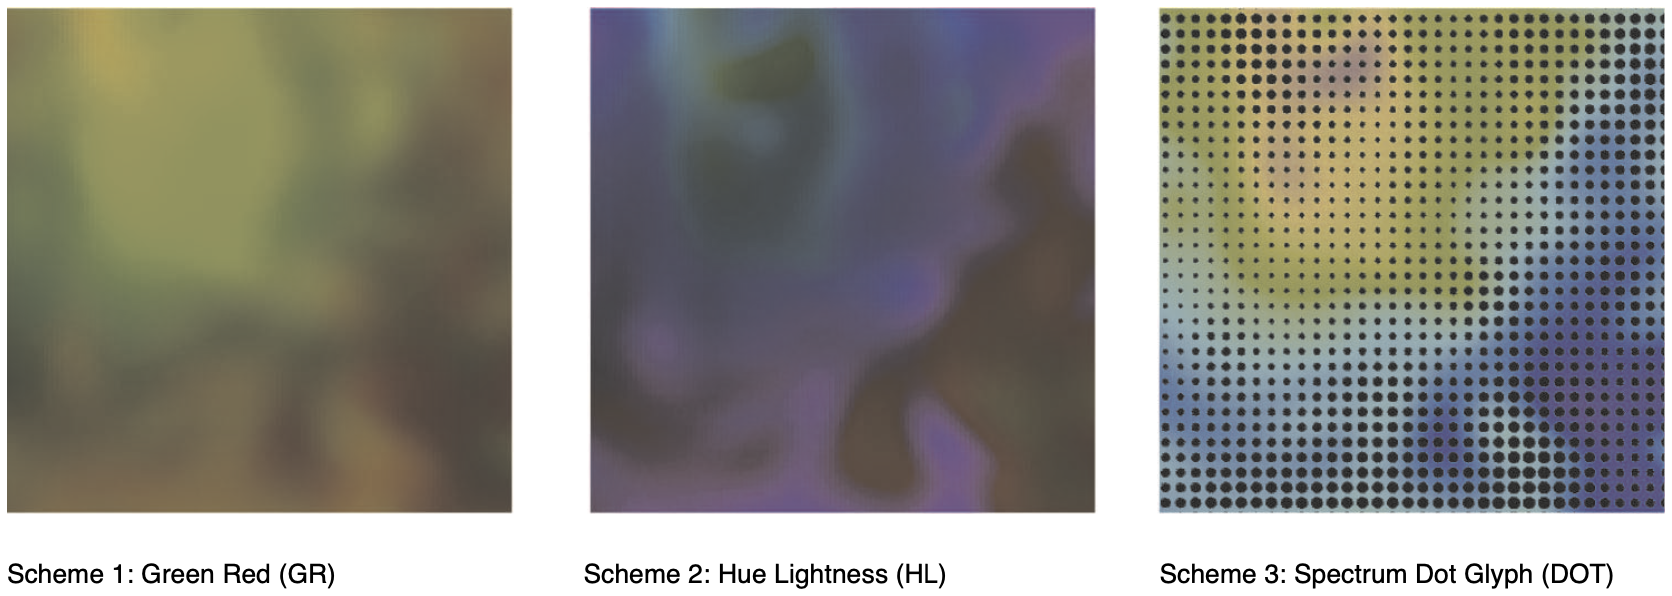
From Colin Ware’s “Quantitative Texton Sequences for Legible Bivariate Maps”
Besides that, I started working on my Weekly Chart that will be published this Thursday. Everyone at Datawrapper writes Weekly Charts, and my one is due this week. I thought about using doing something with color – but maybe not? I haven’t decided yet. Let’s see.