Today was an eventful day. It started with me thinking “Bivariate maps! Heck yeah! Let’s create one in Datawrapper!” and then finding looots of articles on bivariate maps that all wanted to be read…or at least skimmed. Then I got some data and tried my hands on it:
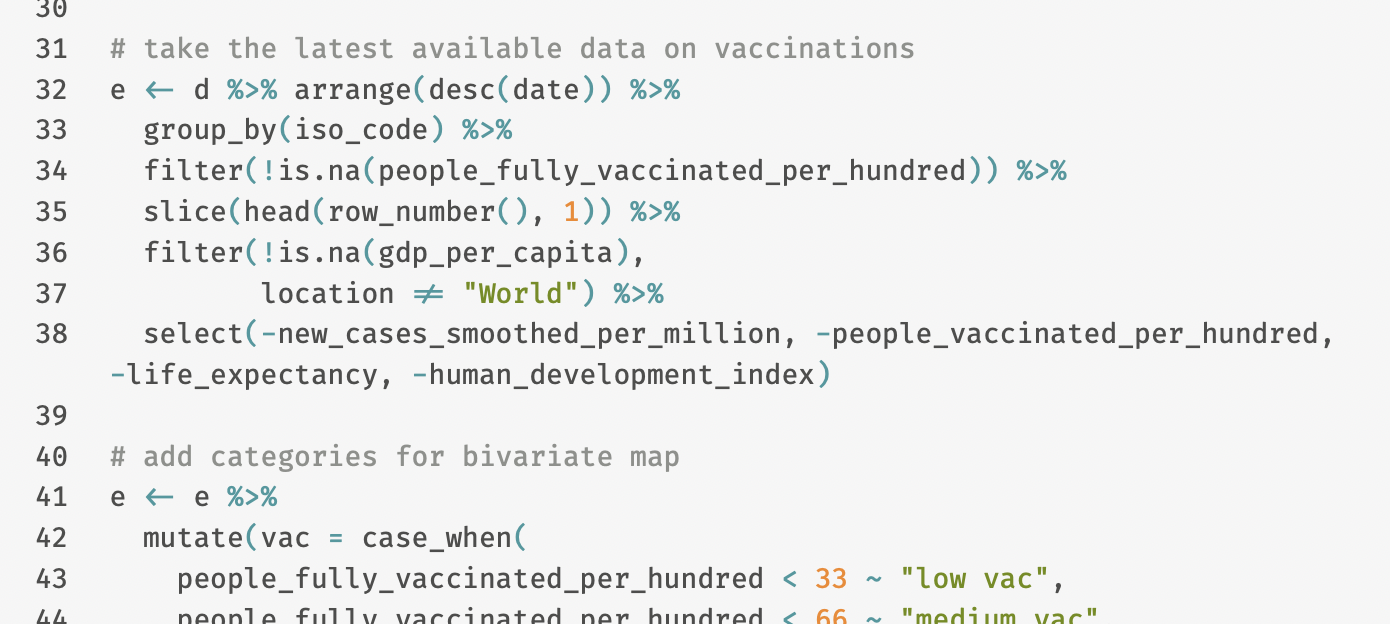
Filtering some data that the good people at Our World in Data prepared on vaccination numbers.Resolve
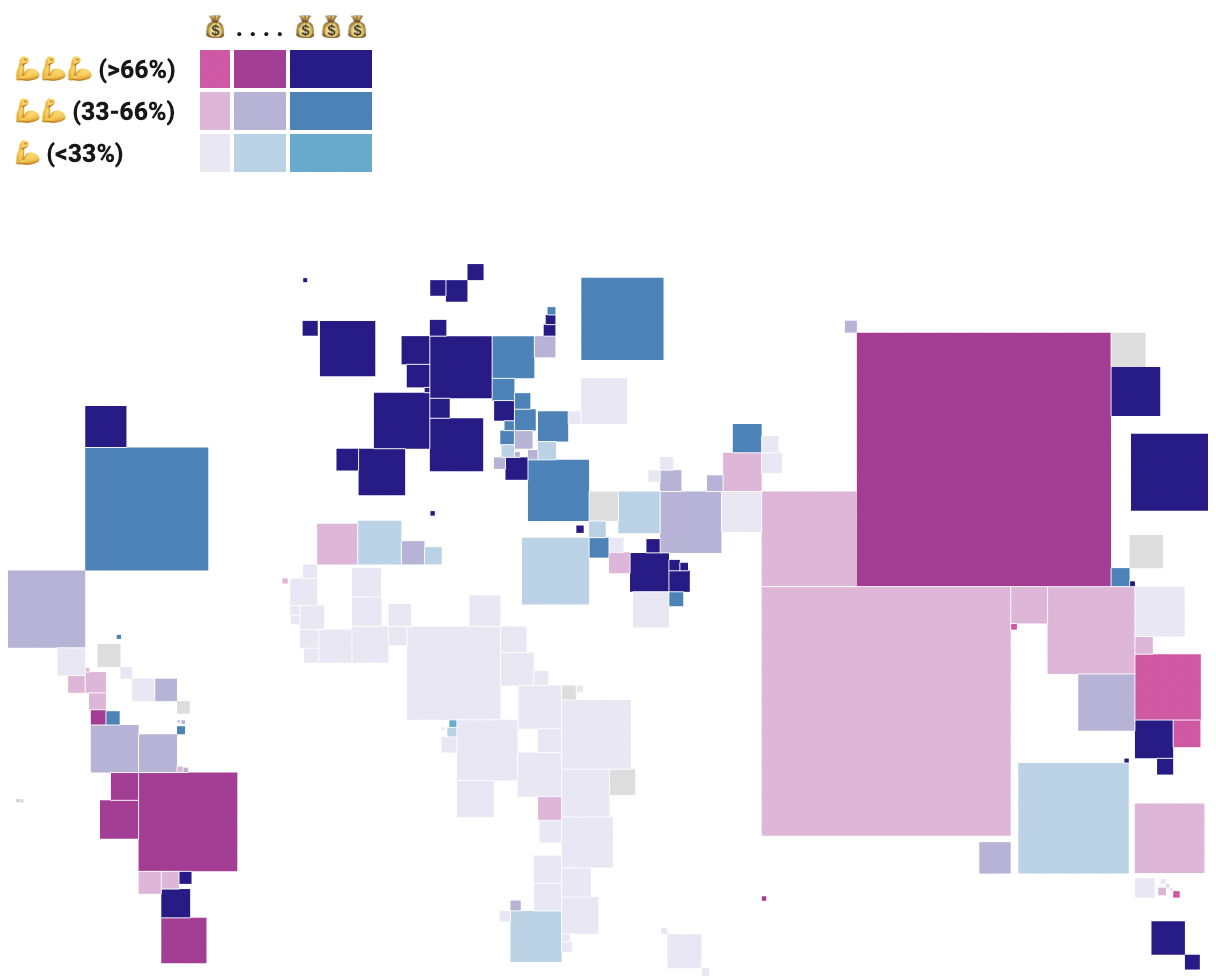
My first try at a bivariate map in Datawrapper, showing GDP per capita (💰) vs vaccination rates (💪).
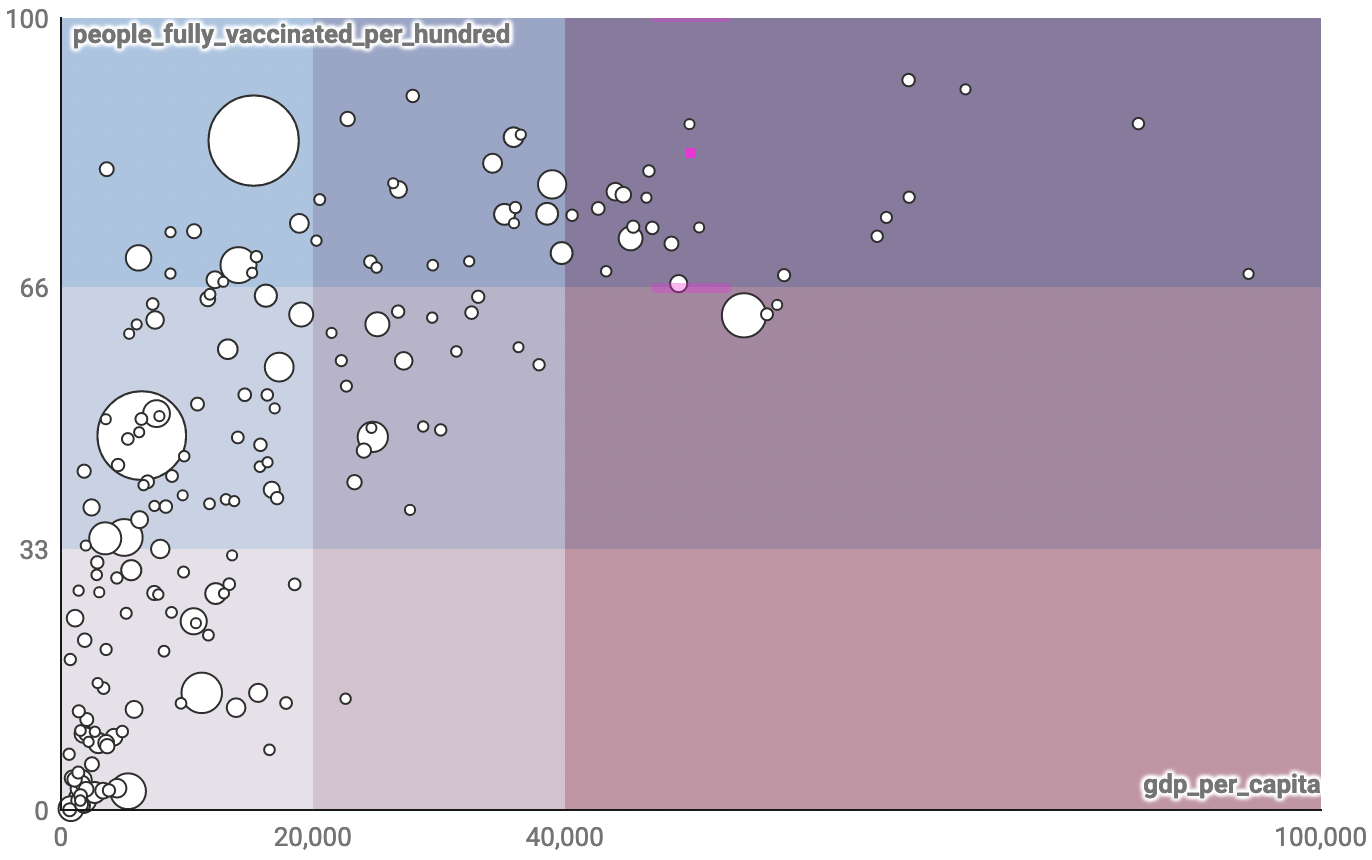
The same data as a Datawrapper scatter plot, with wrong colors.
Bivariate maps are hard to read. In my opinion, they only really work when they show how much of the two or three variables appear somewhere (e.g. low vs high share of Blacks and Hispanics) if these variables (almost) don’t overlap. For example, this bivariate map works super well – it has four steps per variable (which many would say is too much!) but that’s not a problem because the two variables are barely overlapping:
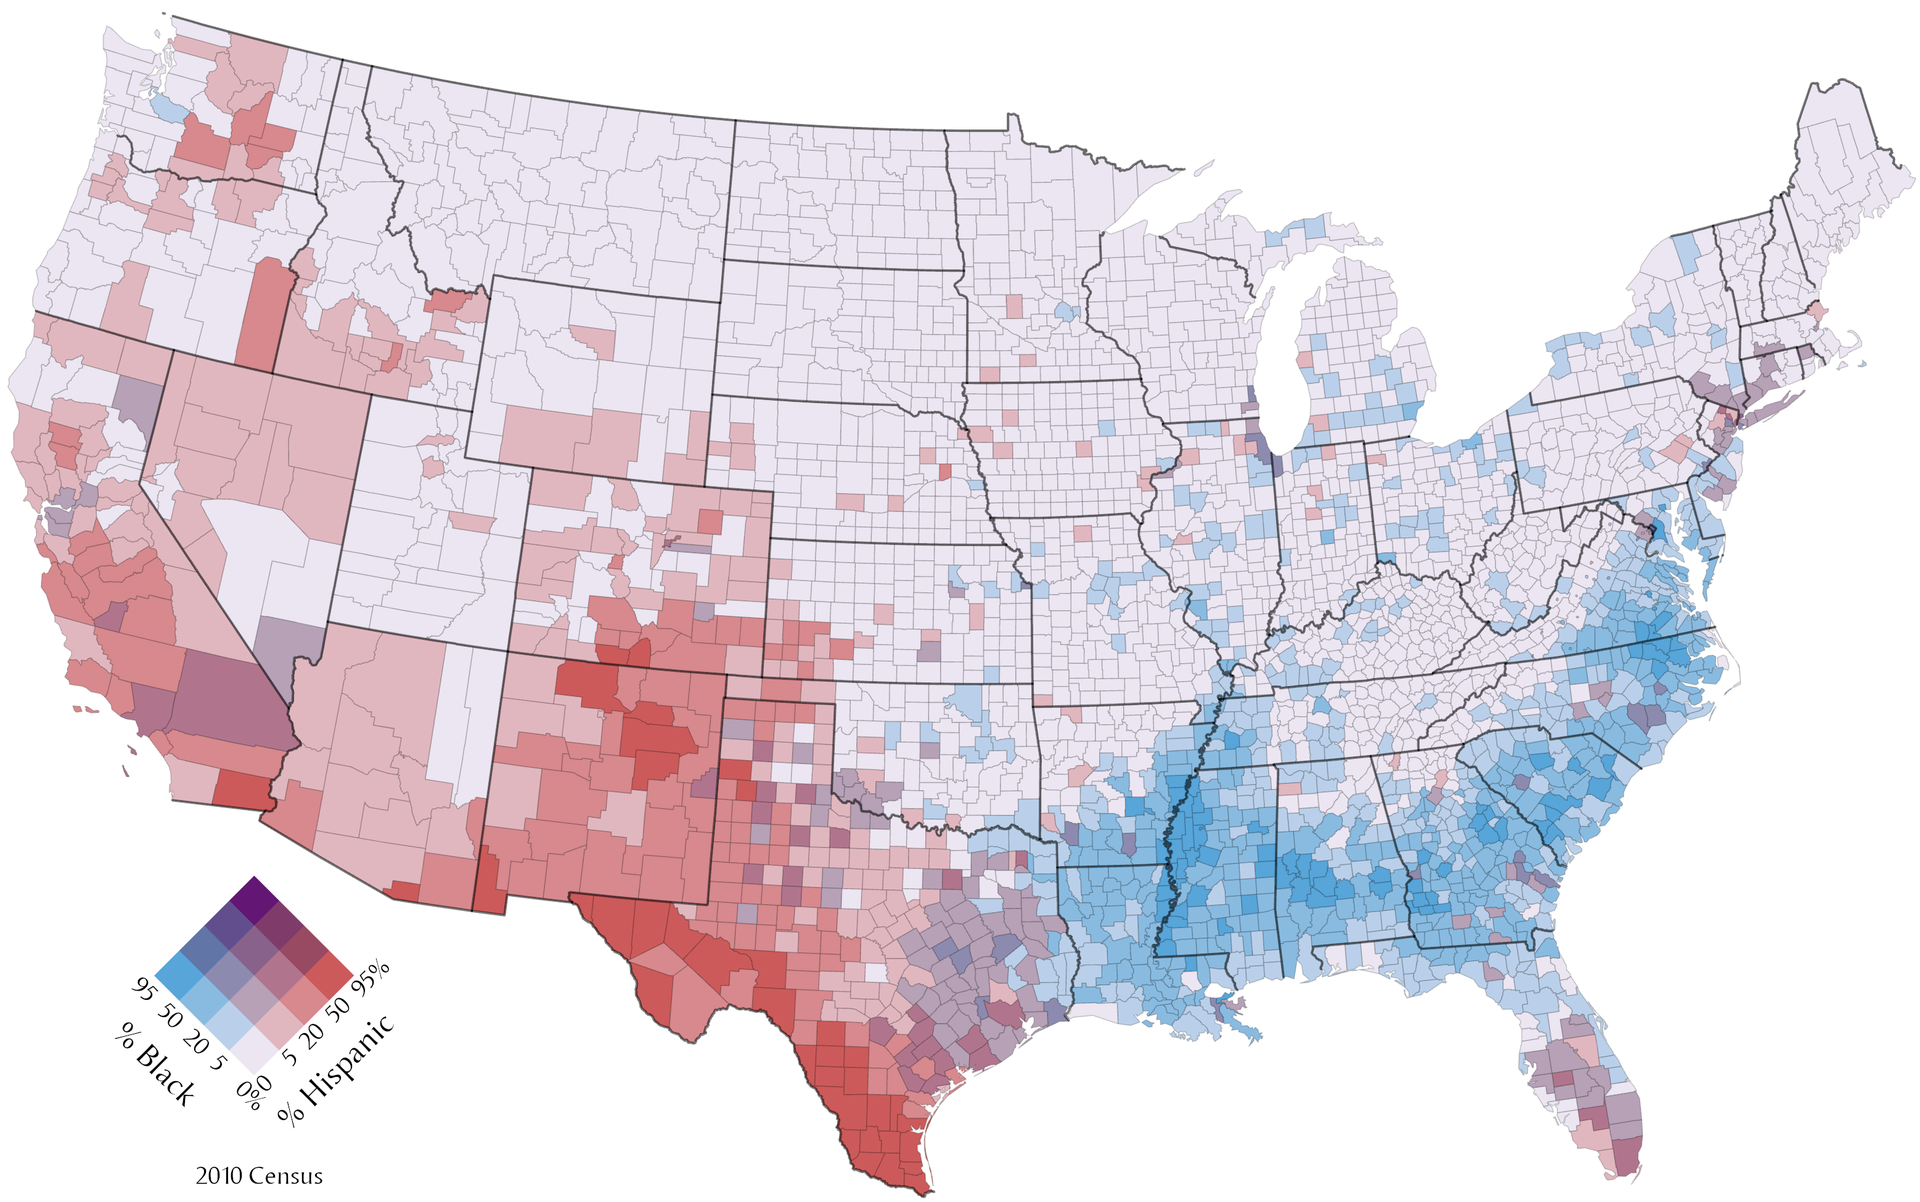
source: Wikipedia
And the following bivariate map works because it shows three categories that are not overlapping at all. We don’t know how much acres of corn are planted where wheat is the dominant crop, and the other way round:
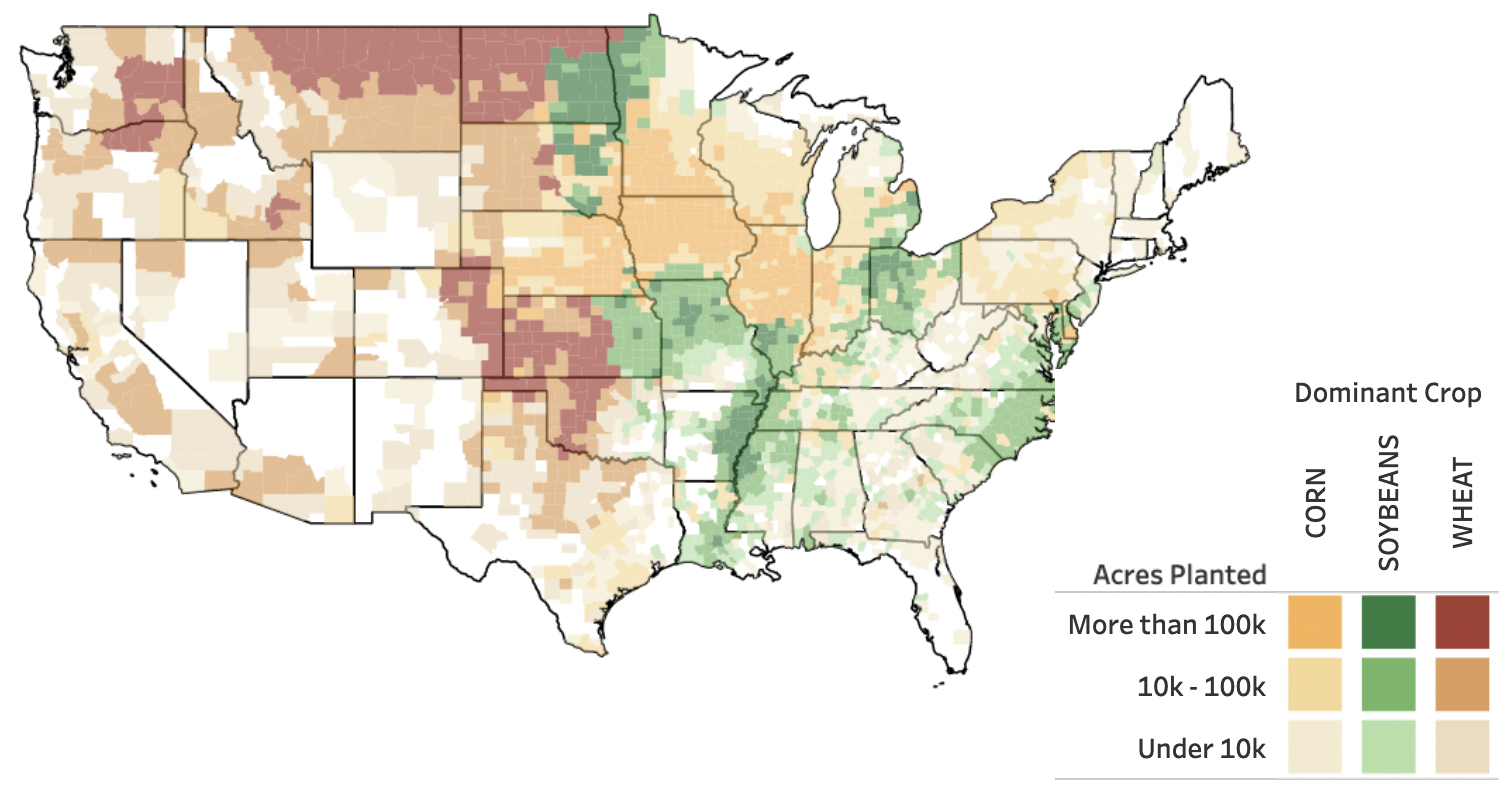
source: Sarah Battersby
These two here are hard to read:
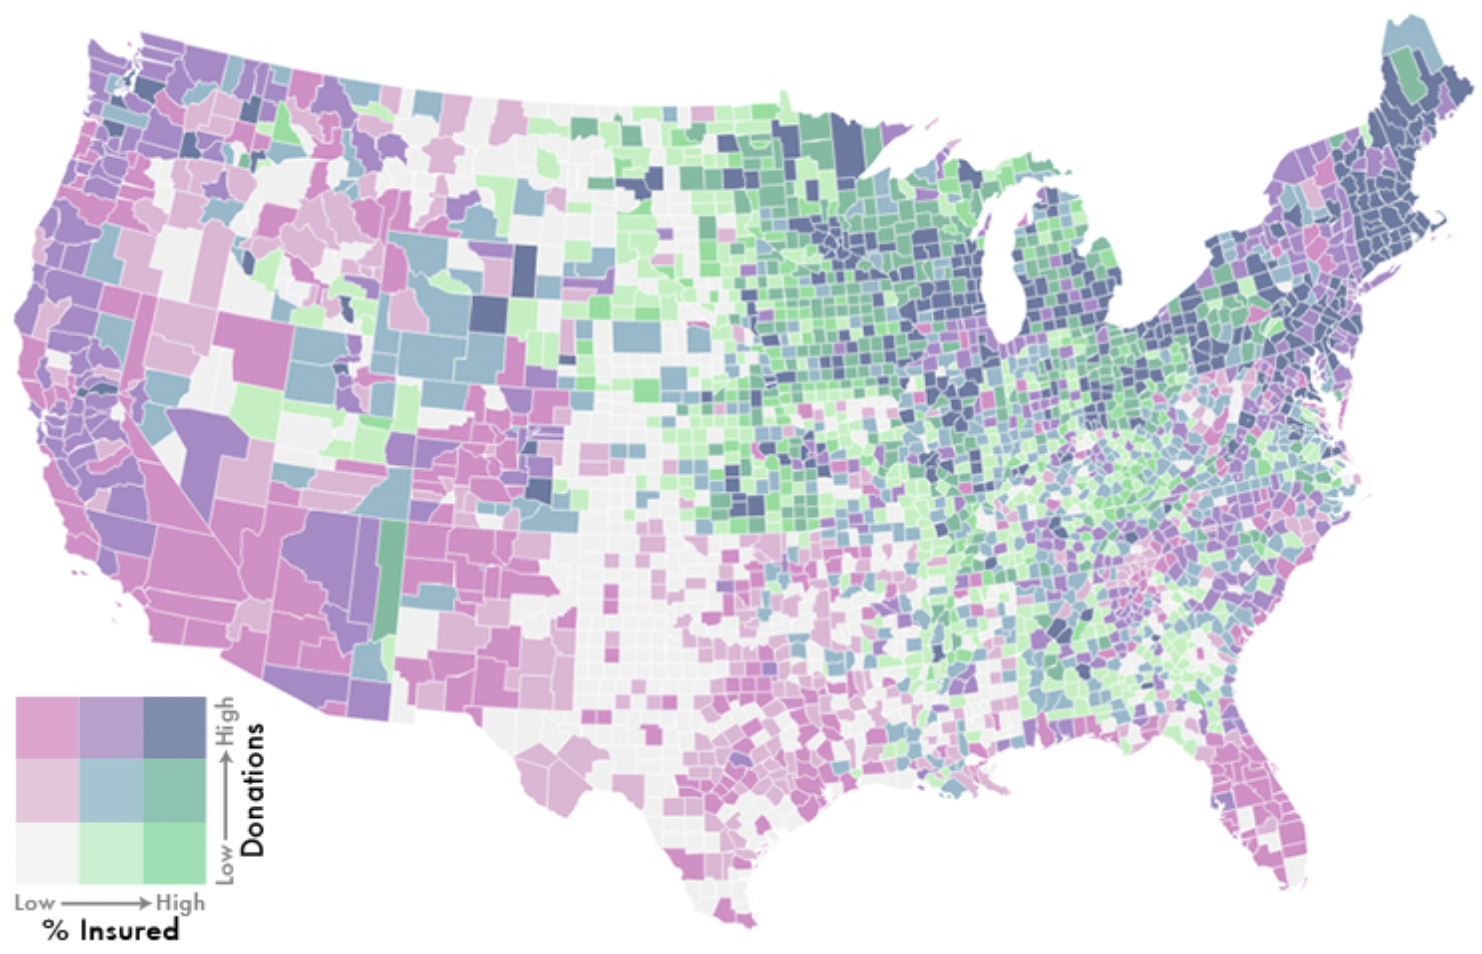
source: Joshua Stevens
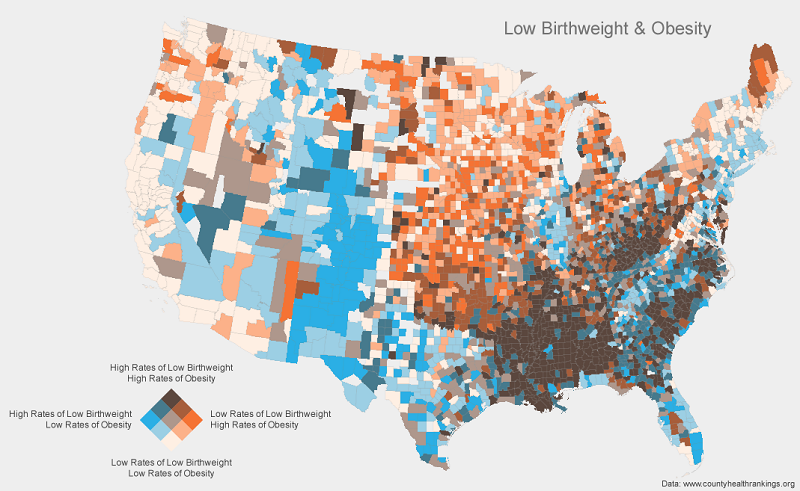
source: GIS&T Body of Knowledge
And my bivariate map up there also doesn’t really work well…because of these overlappings. It doesn’t feel like reading a normal choropleth map, where it goes like “Ok, this is darker, so that means it’s more of x.” It feels more like holding nine categories in your head and constantly checking the color key to understand it (”what does orange mean again? Ah right. And this dark blue here? Ah yes, that’s between x and y.”)
The rest of the day I drafted a blog announcement for a feature we’ll announce soon-ish at Datawrapper…and I prepared the Data Vis Book Club discussion that happened today at 6pm UTC! Like always, it was really nice.
While it was underway, I felt so much gratefulness for being able to gather some people to talk about something I care about. Also, surprisingly many people showed up for the discussion of a not-cheap textbook! And the attendees still seemed happy with the written form. We already discussed what we’ll read next – I’ll also do a Twitter survey to ask a few more people.
This was a long, nice day – see you tomorrow!