Today we launched Dark Mode (is it “dark mode” or “Dark Mode”? I prefer “Dark Mode”) for all embedded Datawrapper visualizations, and I was mostly busy with getting the blog post out: https://blog.datawrapper.de/dark-mode-for-embedded-visualizations/, and the Academy article, and then monitoring Twitter for the responses (they were good! People like it. That’s always nice.)
I also gave a bit of feedback to Eddie’s Weekly Chart. It’s about Lego! Who doesn’t like Lego. Look at all these colors they added in the past few years:
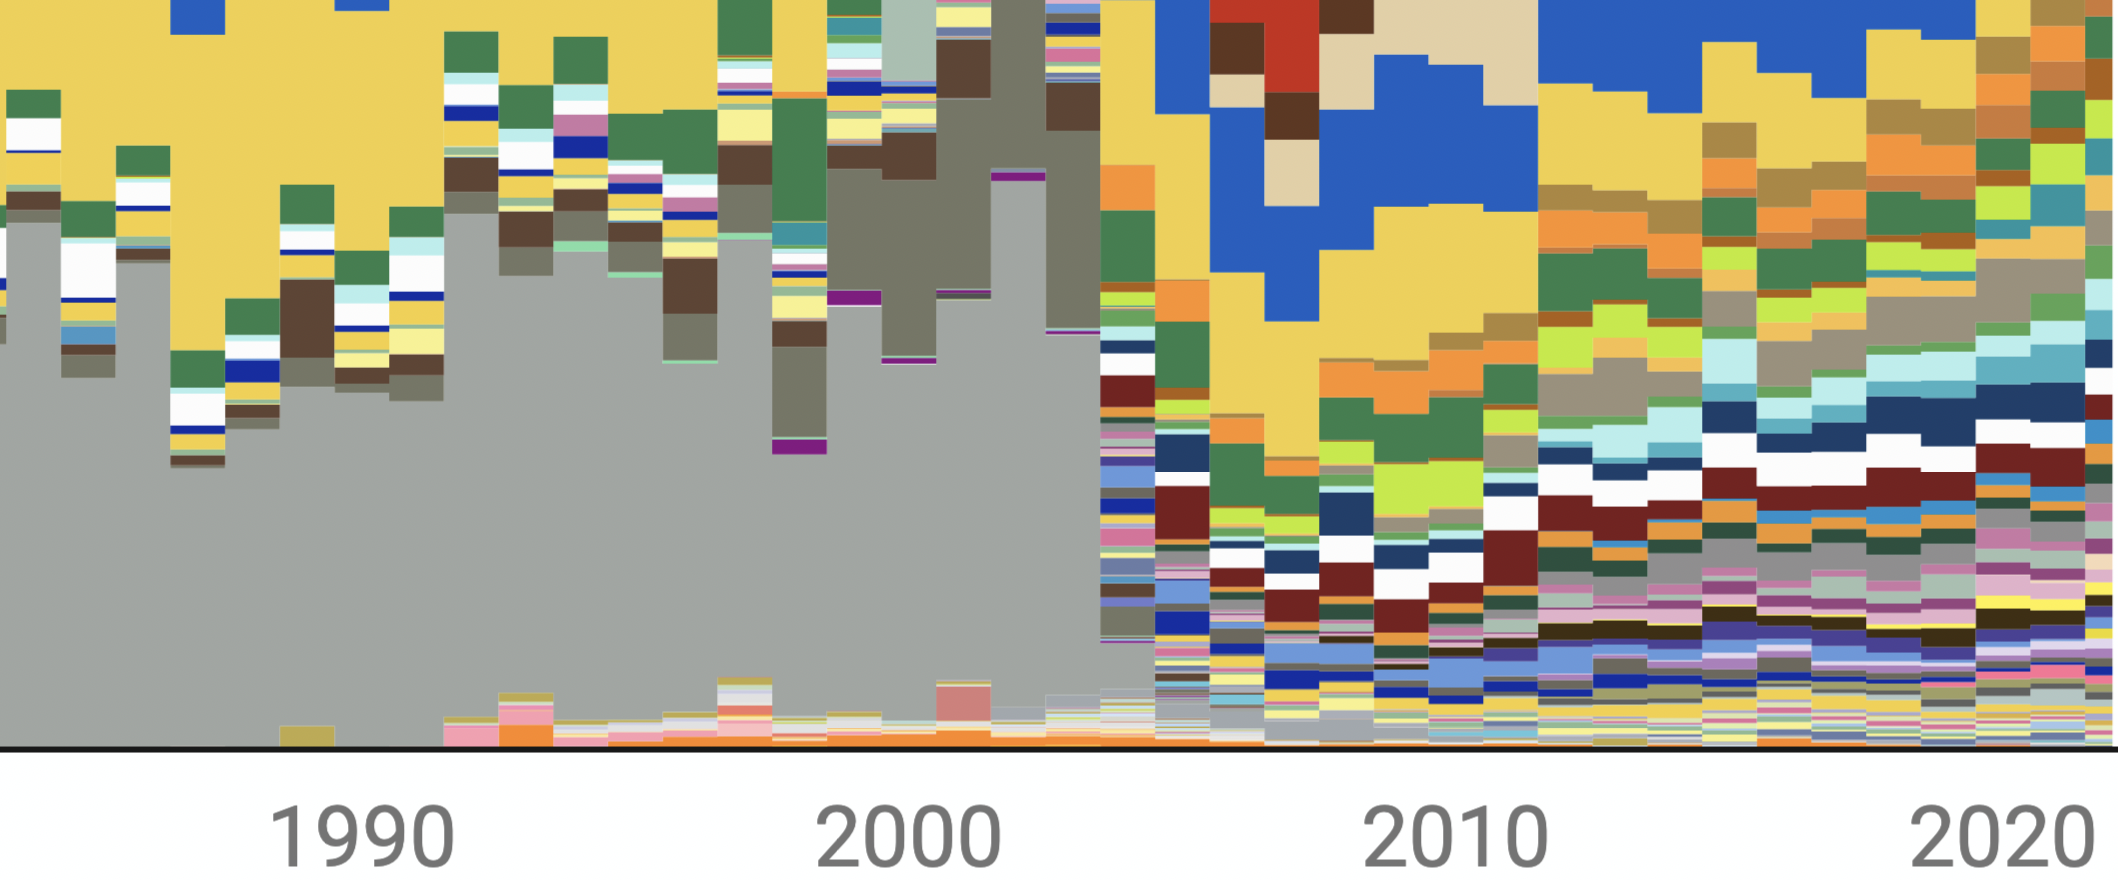
What a modern bright green, and dark red, and these shades of blue and blue-green…nice.
Oh, and I stared at the gradient in this chart by the great Nathan Yau for a while:
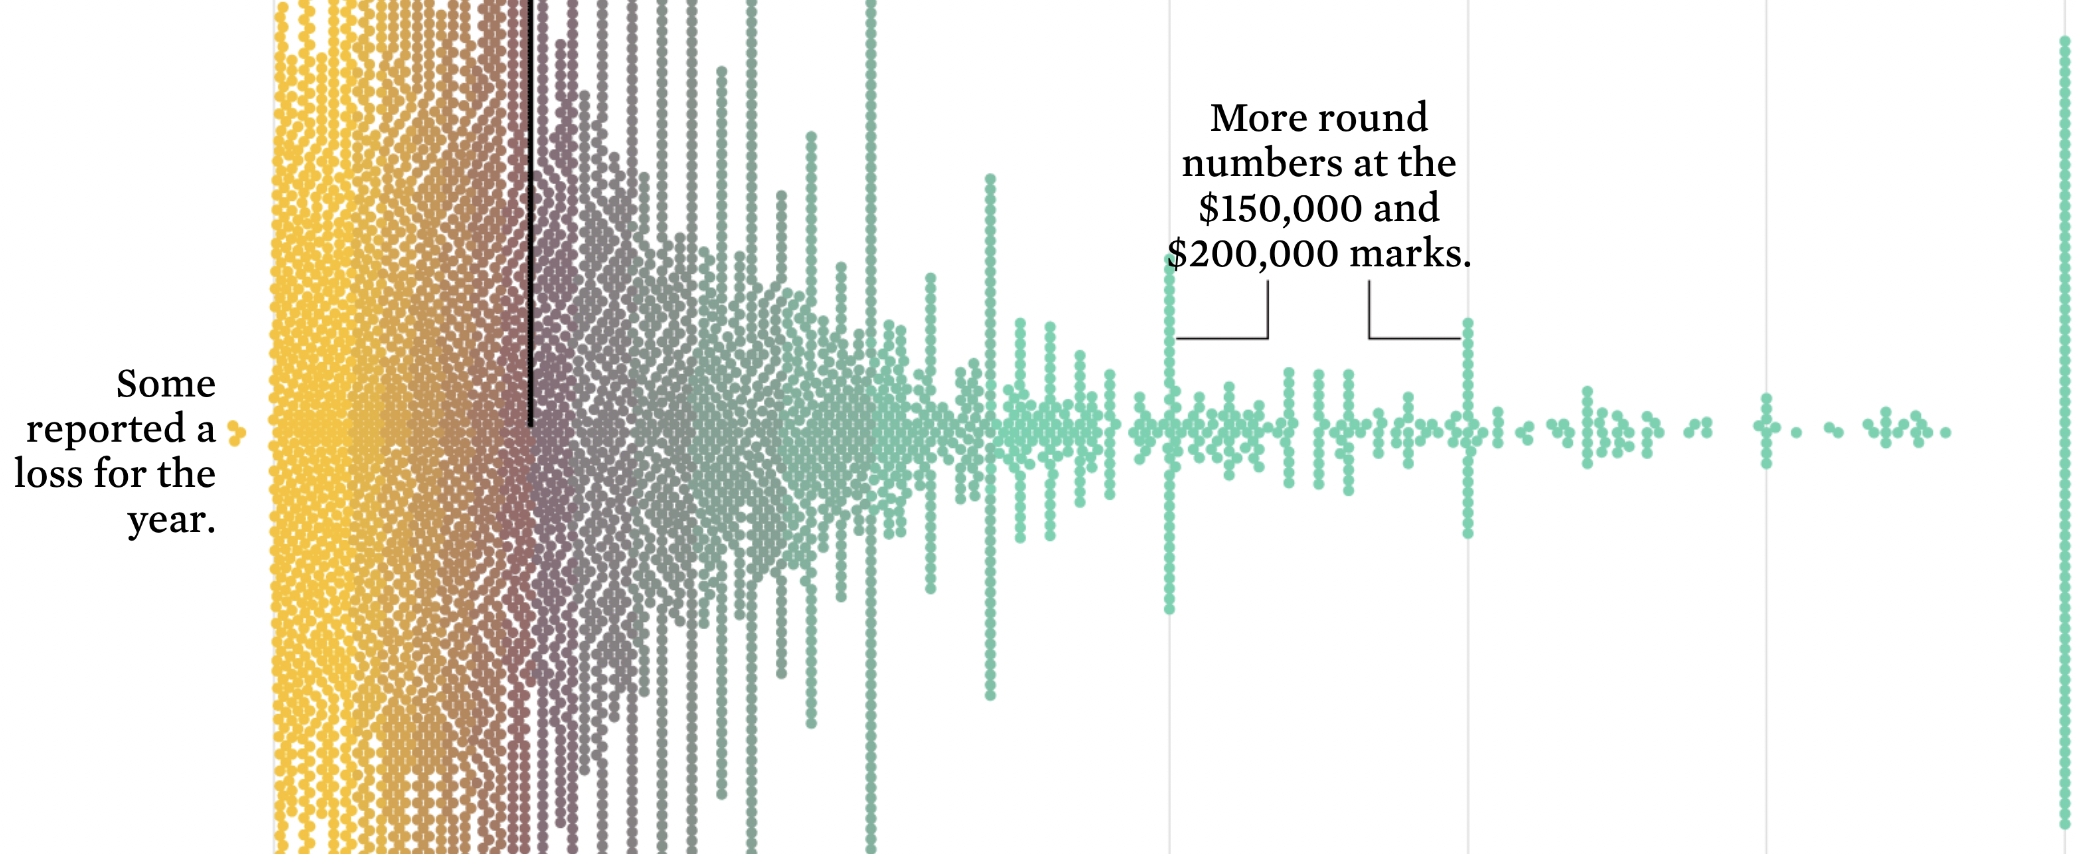
I couldn’t decide if I like it or not.
If I did anything for the book today, you ask? Nope. Not at all. Next week!