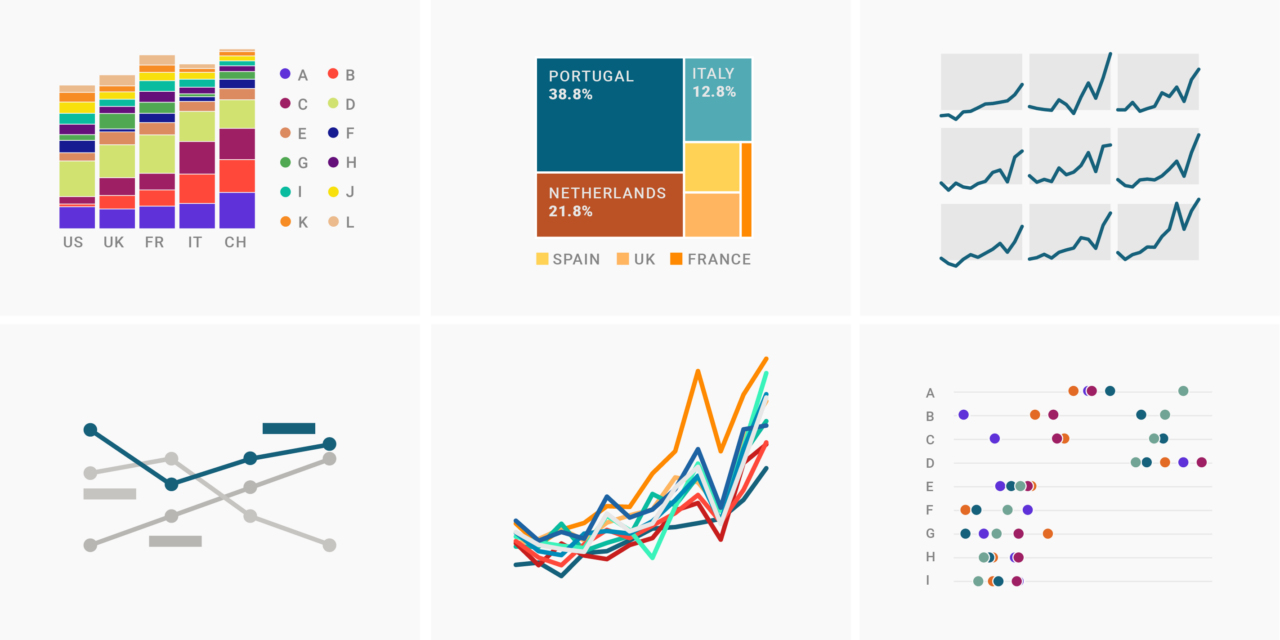
Today I published a blog post 🥳 Getting an article out always takes more time than expected, but always feels great. And I’m also fairly happy with it. So…that’s good.
The title of the blog post is 10 ways to use fewer colors in your data visualizations, which is the most clickbait-y listicle-y title I’ve ever used. “Most ever”, because I used a “listicle title” before – for my blog post 17 (or so) responsible live visualizations about the coronavirus, for you to use. But that “(or so”) defused it a bit.
The blog post title today is pure listicleness.
Did I adjust the content so that it fits exactly 10 pieces of advice? No! I was surprised myself when I put together the index and noticed that it’s exactly ten. It was then that I changed the title from “How to use…” to “10 ways to…”.
And still, I felt a bit bad about it. I was about to explain myself in the blog post itself. Then, when tweeting about it, I was short of explaining myself there. I decided that nope, I shouldn’t do that…but now here we are. Hi! Sigh.
I also continued working on the next blog post (the “color palettes in style guide” one). Remember this little illustration here that I posted last week?
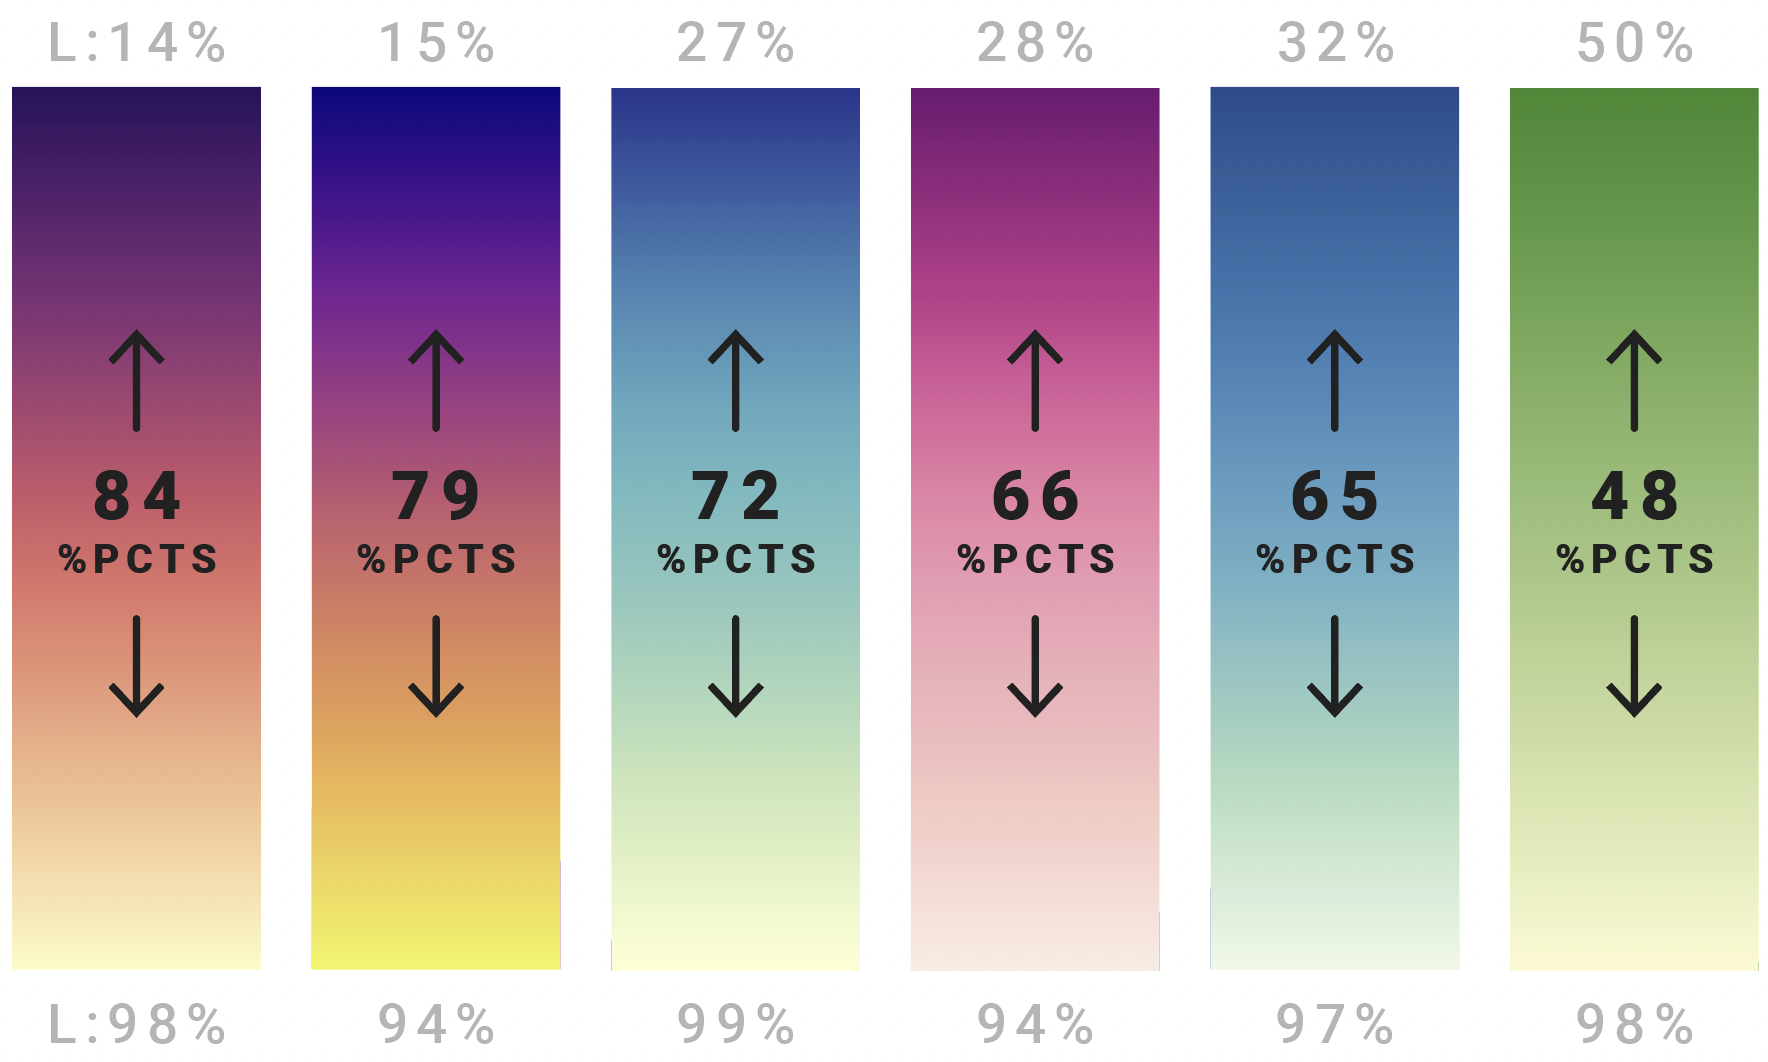
Lightness range (measured in the LCH color space) that our Datawrapper default gradients cover.
I found a better way to visualize it. Here’s a draft:
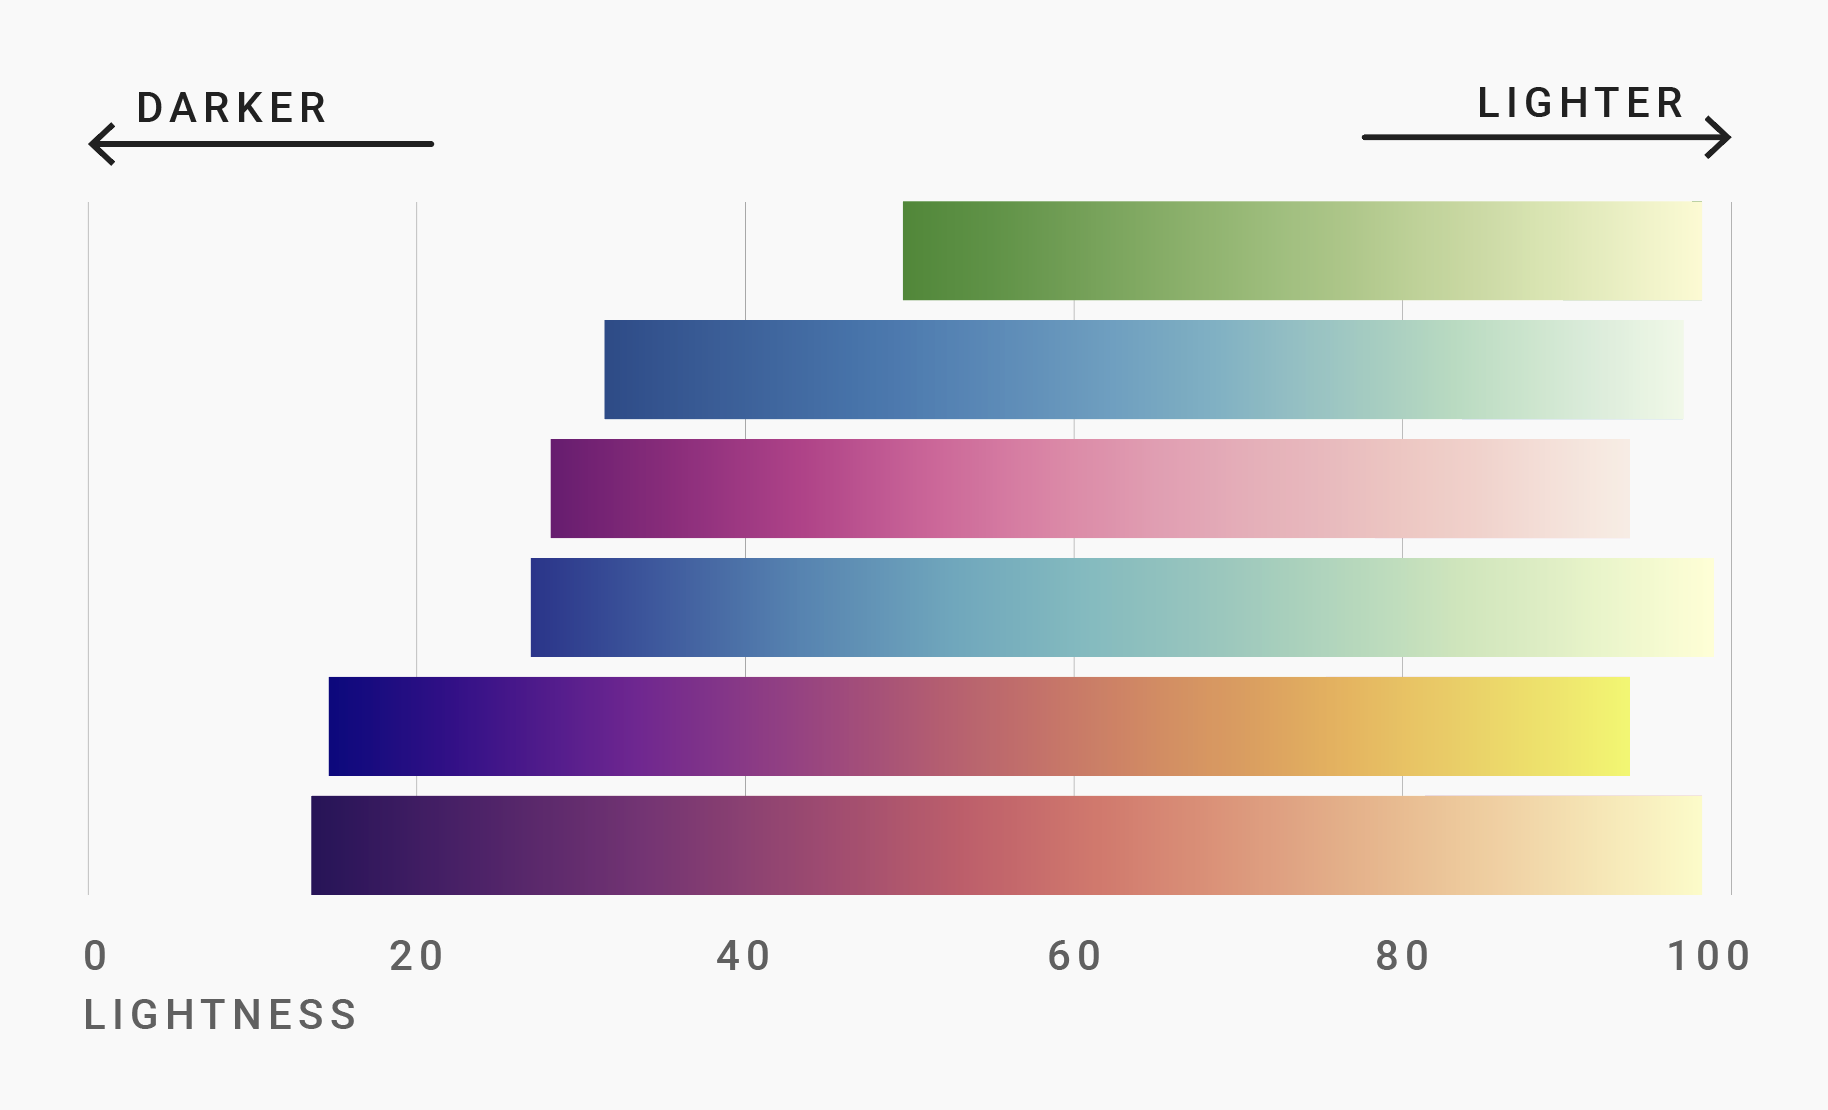
It makes so much sense! And I just didn’t think of it last week 🤦♀️.