I went to the office today! That was nice. A lot of people were there, and we had a very nice Thai lunch together. I also spent more time on the hiring process, talked with our CEO and then had a 2h 😱 feedback session with Rose (We didn’t do a break. We should have done a break.)
Could that have been coded nicer? Yes. Does it work anyway? Yes.
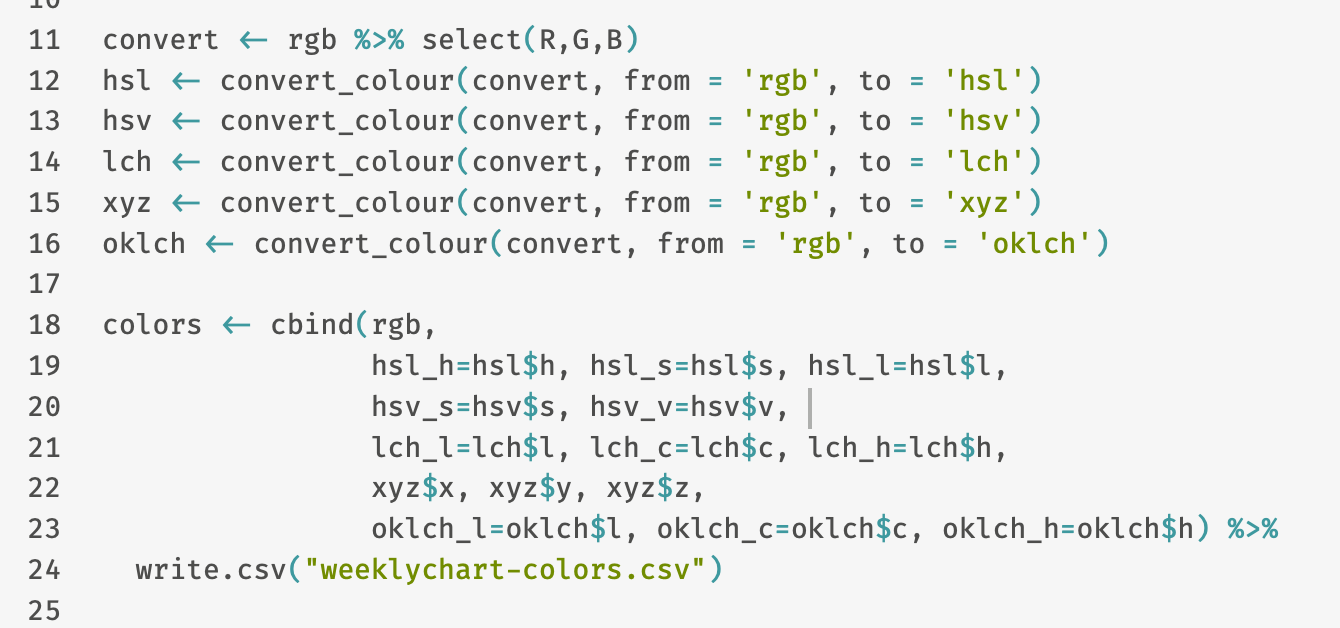
At the end of the day, I tried to get at least a little bit more done for the Weekly Chart on colors, so I a) wrote a little R script based on another R script I already that converts my RGB values into HSL values and HSV values and LCH values, etc.
And here, I proudly present: All 19 backgrounds of data visualizations I could find in The Pudding visualizations since May 2020 🥳
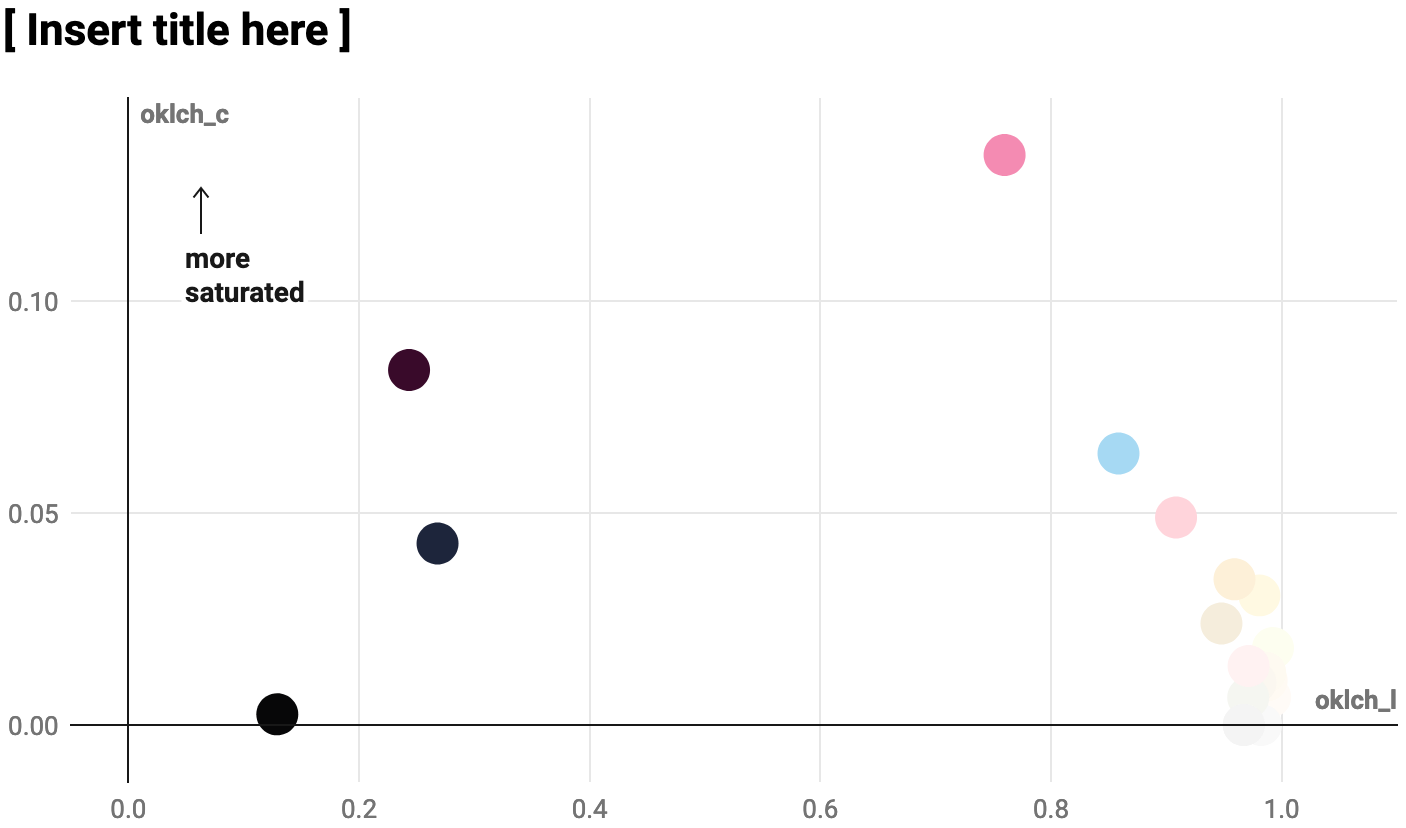
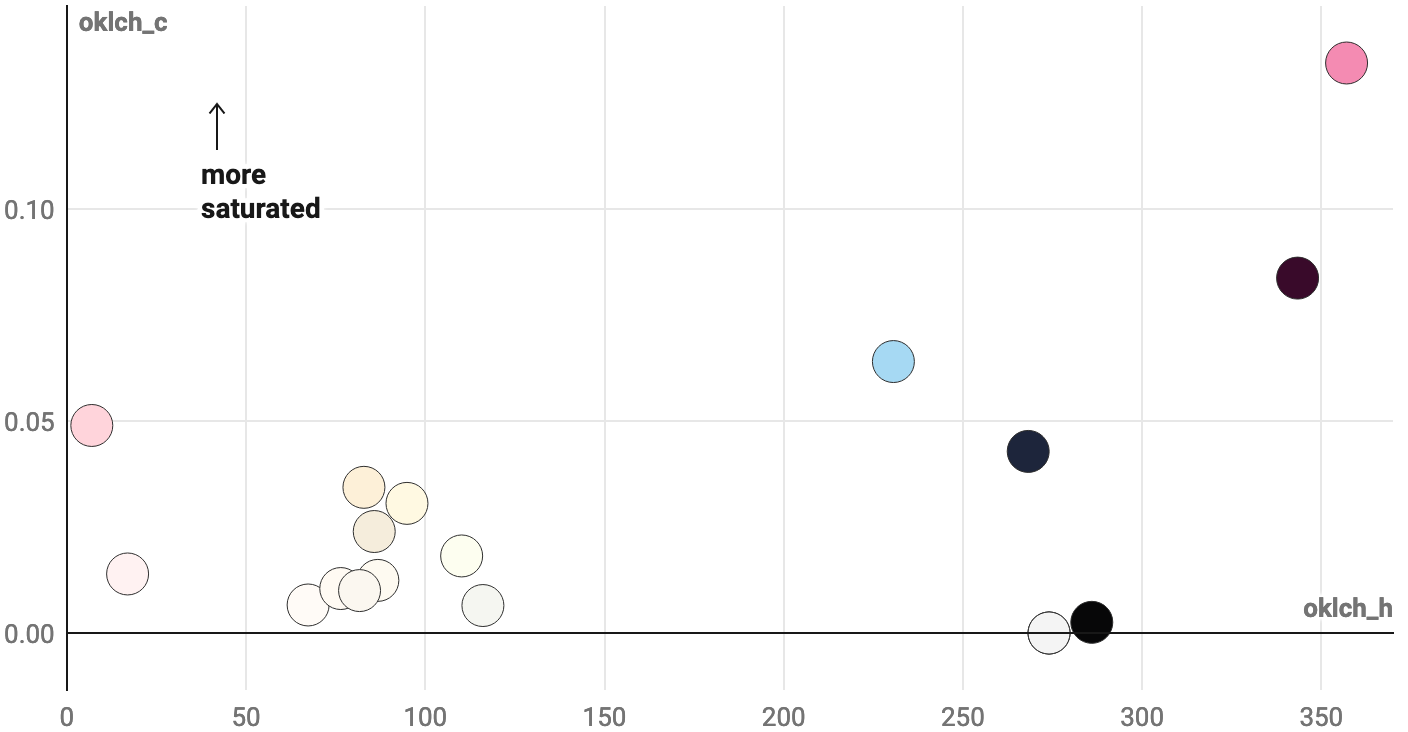
This chart is far from finished (regarding data and design), but, yay, it’s a start! Tomorrow I’ll collect a lot more background hex codes. That will be fun.