Data vis peeps love to argue: Do y-axes always need to start at zero? Are pie charts evil? What’s more important: attention-grabbing visuals or readability? And should bar charts be avoided because they’re plainly boring?
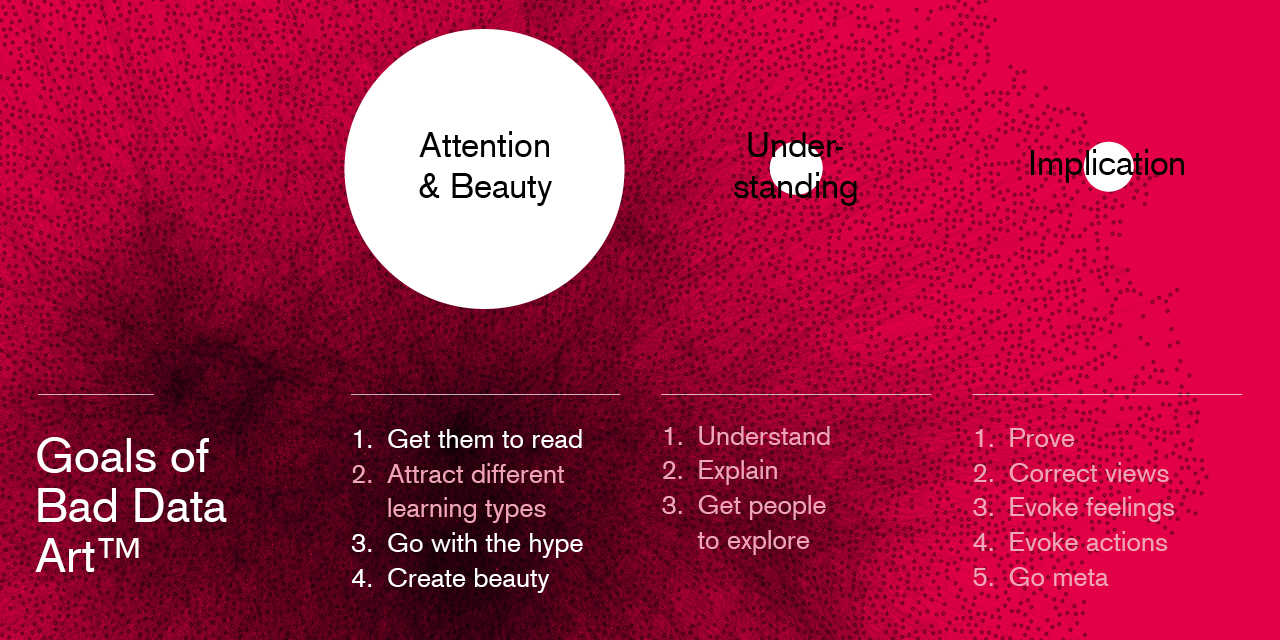
In June 2018, I looked back at the biggest arguments in the past few years, while sneaking some data vis rules into the brains of the audience. It’s a look back at the community and a lot of old blog posts & tweets.
The occassion? The Netzwerk Recherche Jahreskonferenz in Hamburg, a cozy journalism conference with free fries. It’s one of my favorite conferences I’ve been to (not just because of the fries).
Here I just show a selection of slides from the talk. To download the complete PDF, head over to this Github repo.
→ All slides of this talk on Github


