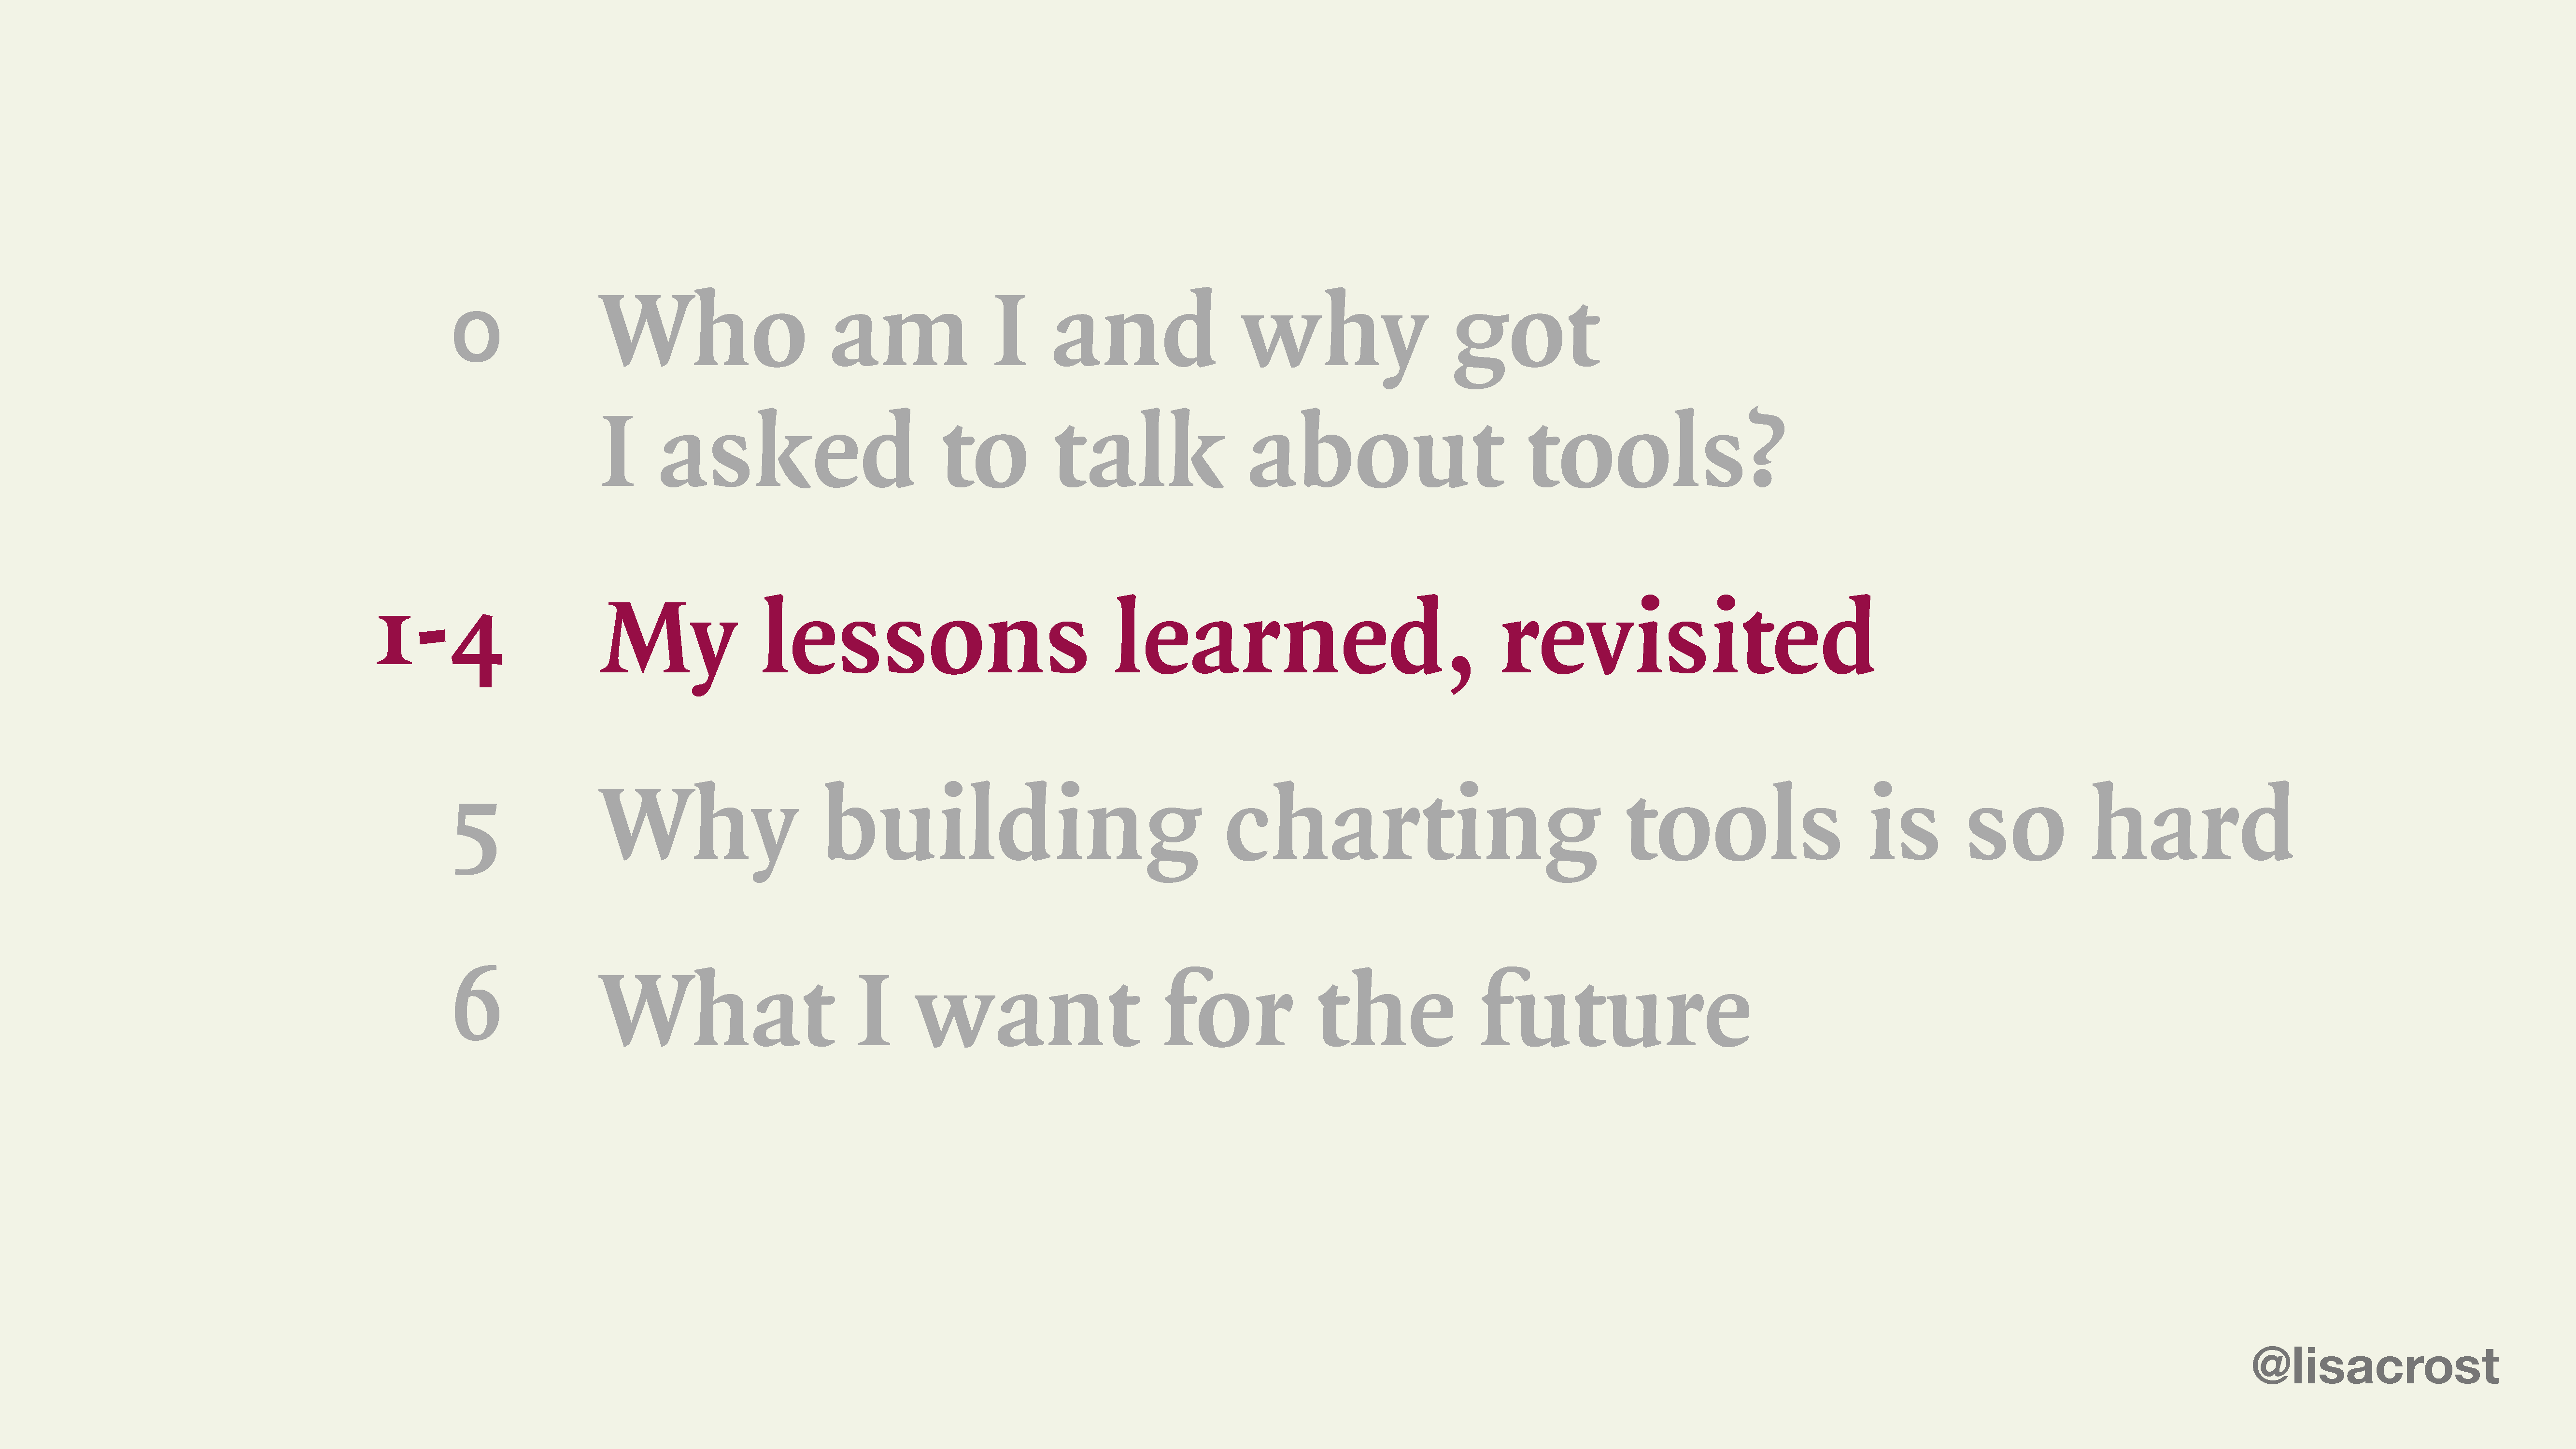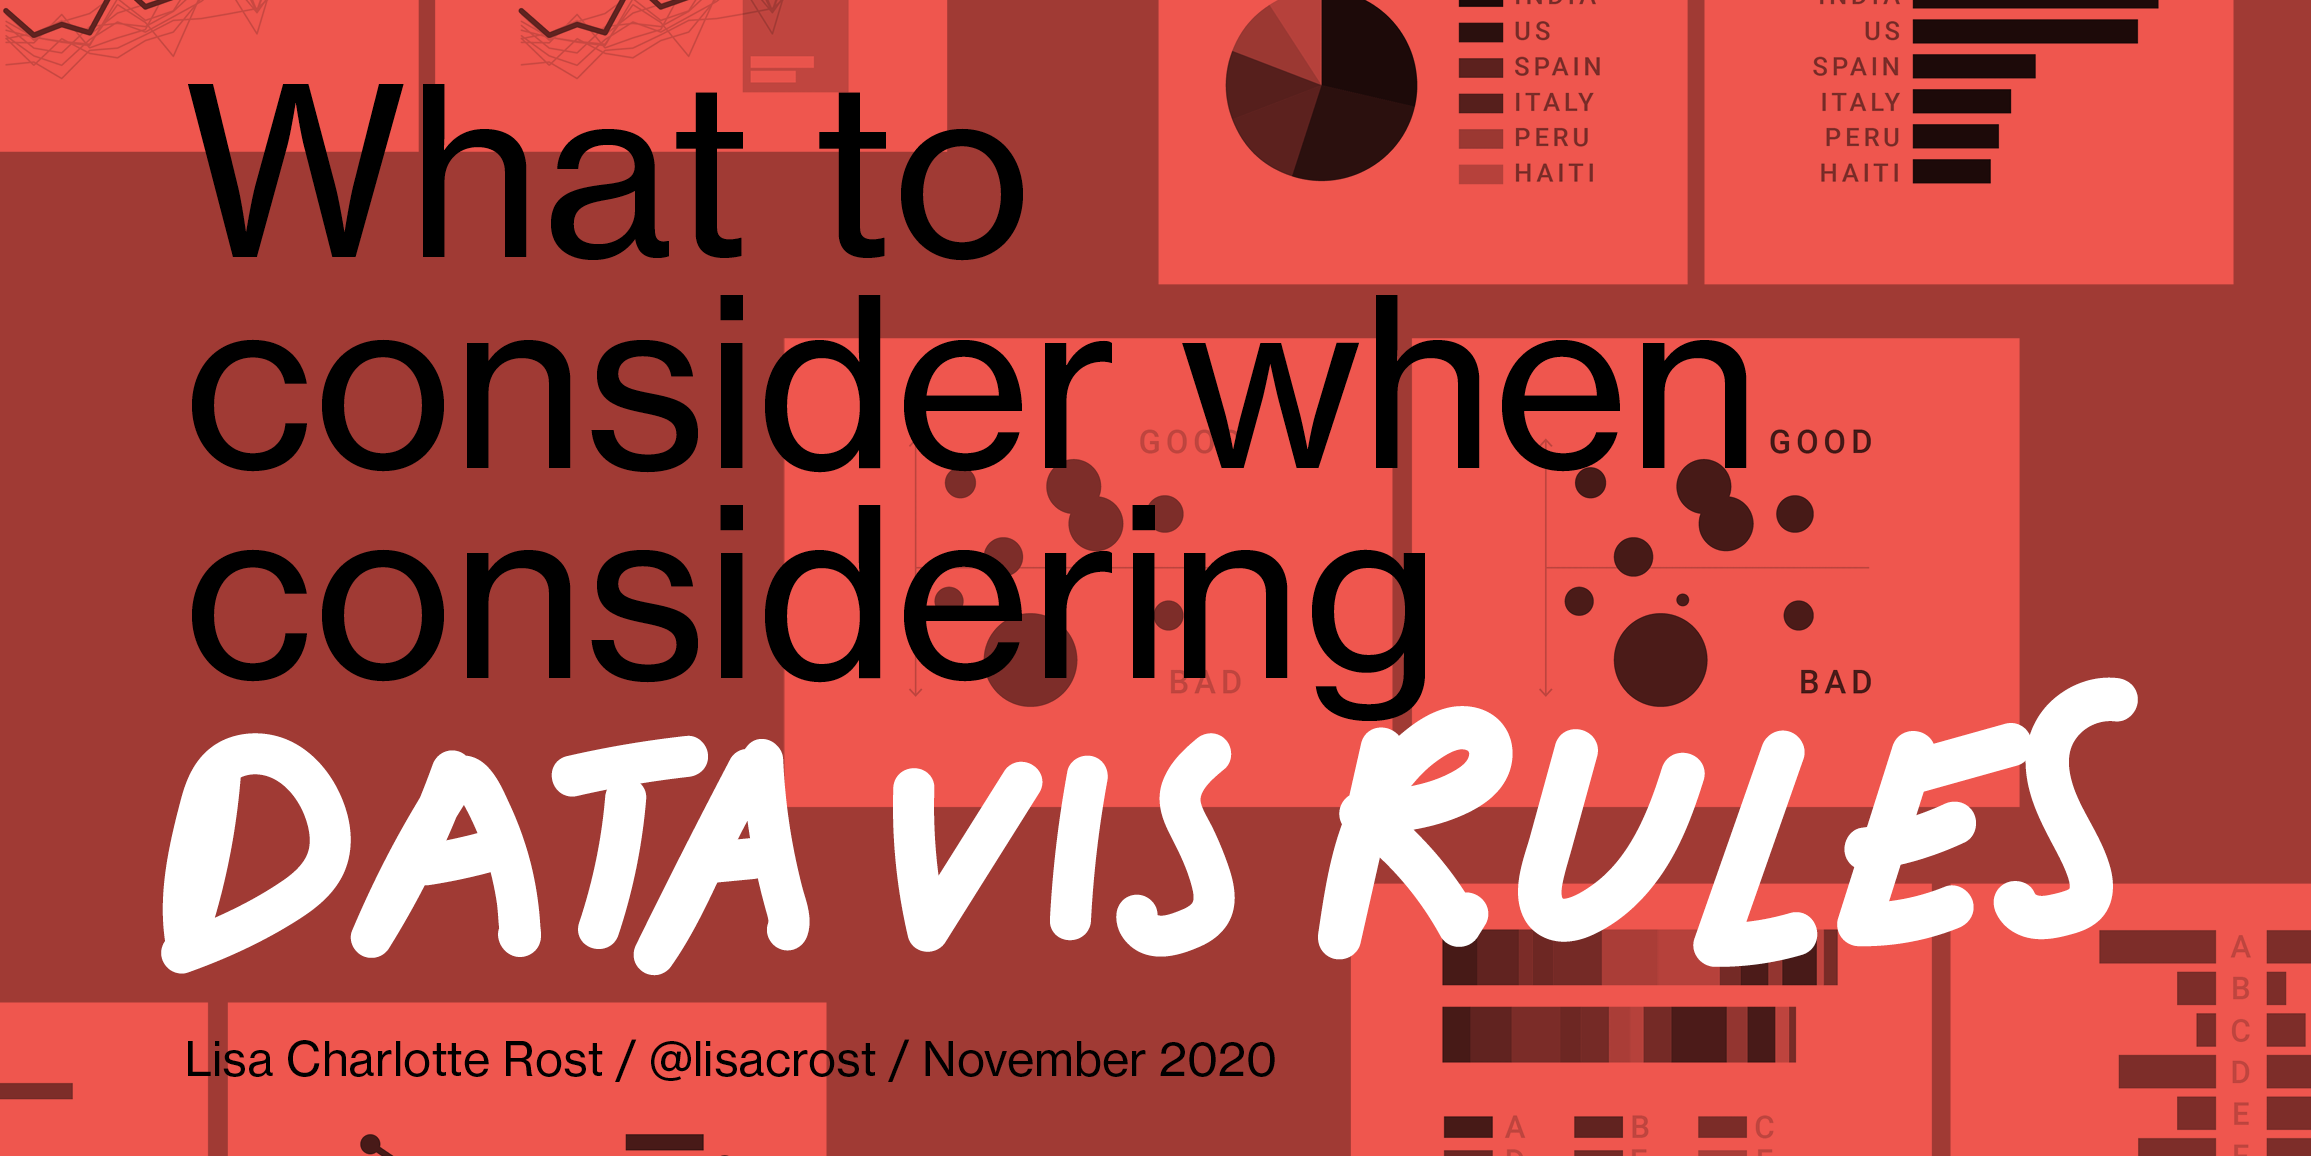
I gave this 30min presentation at Vis in Practice (“dedicated to everyone interested in the practical aspects of data visualization and visual analytics”) at IEEE VIS (“the worldwide largest and most important conference on Scientific Visualization, Information Visualization and Visual Analytics”) in Berlin, Germany, in October 2018.
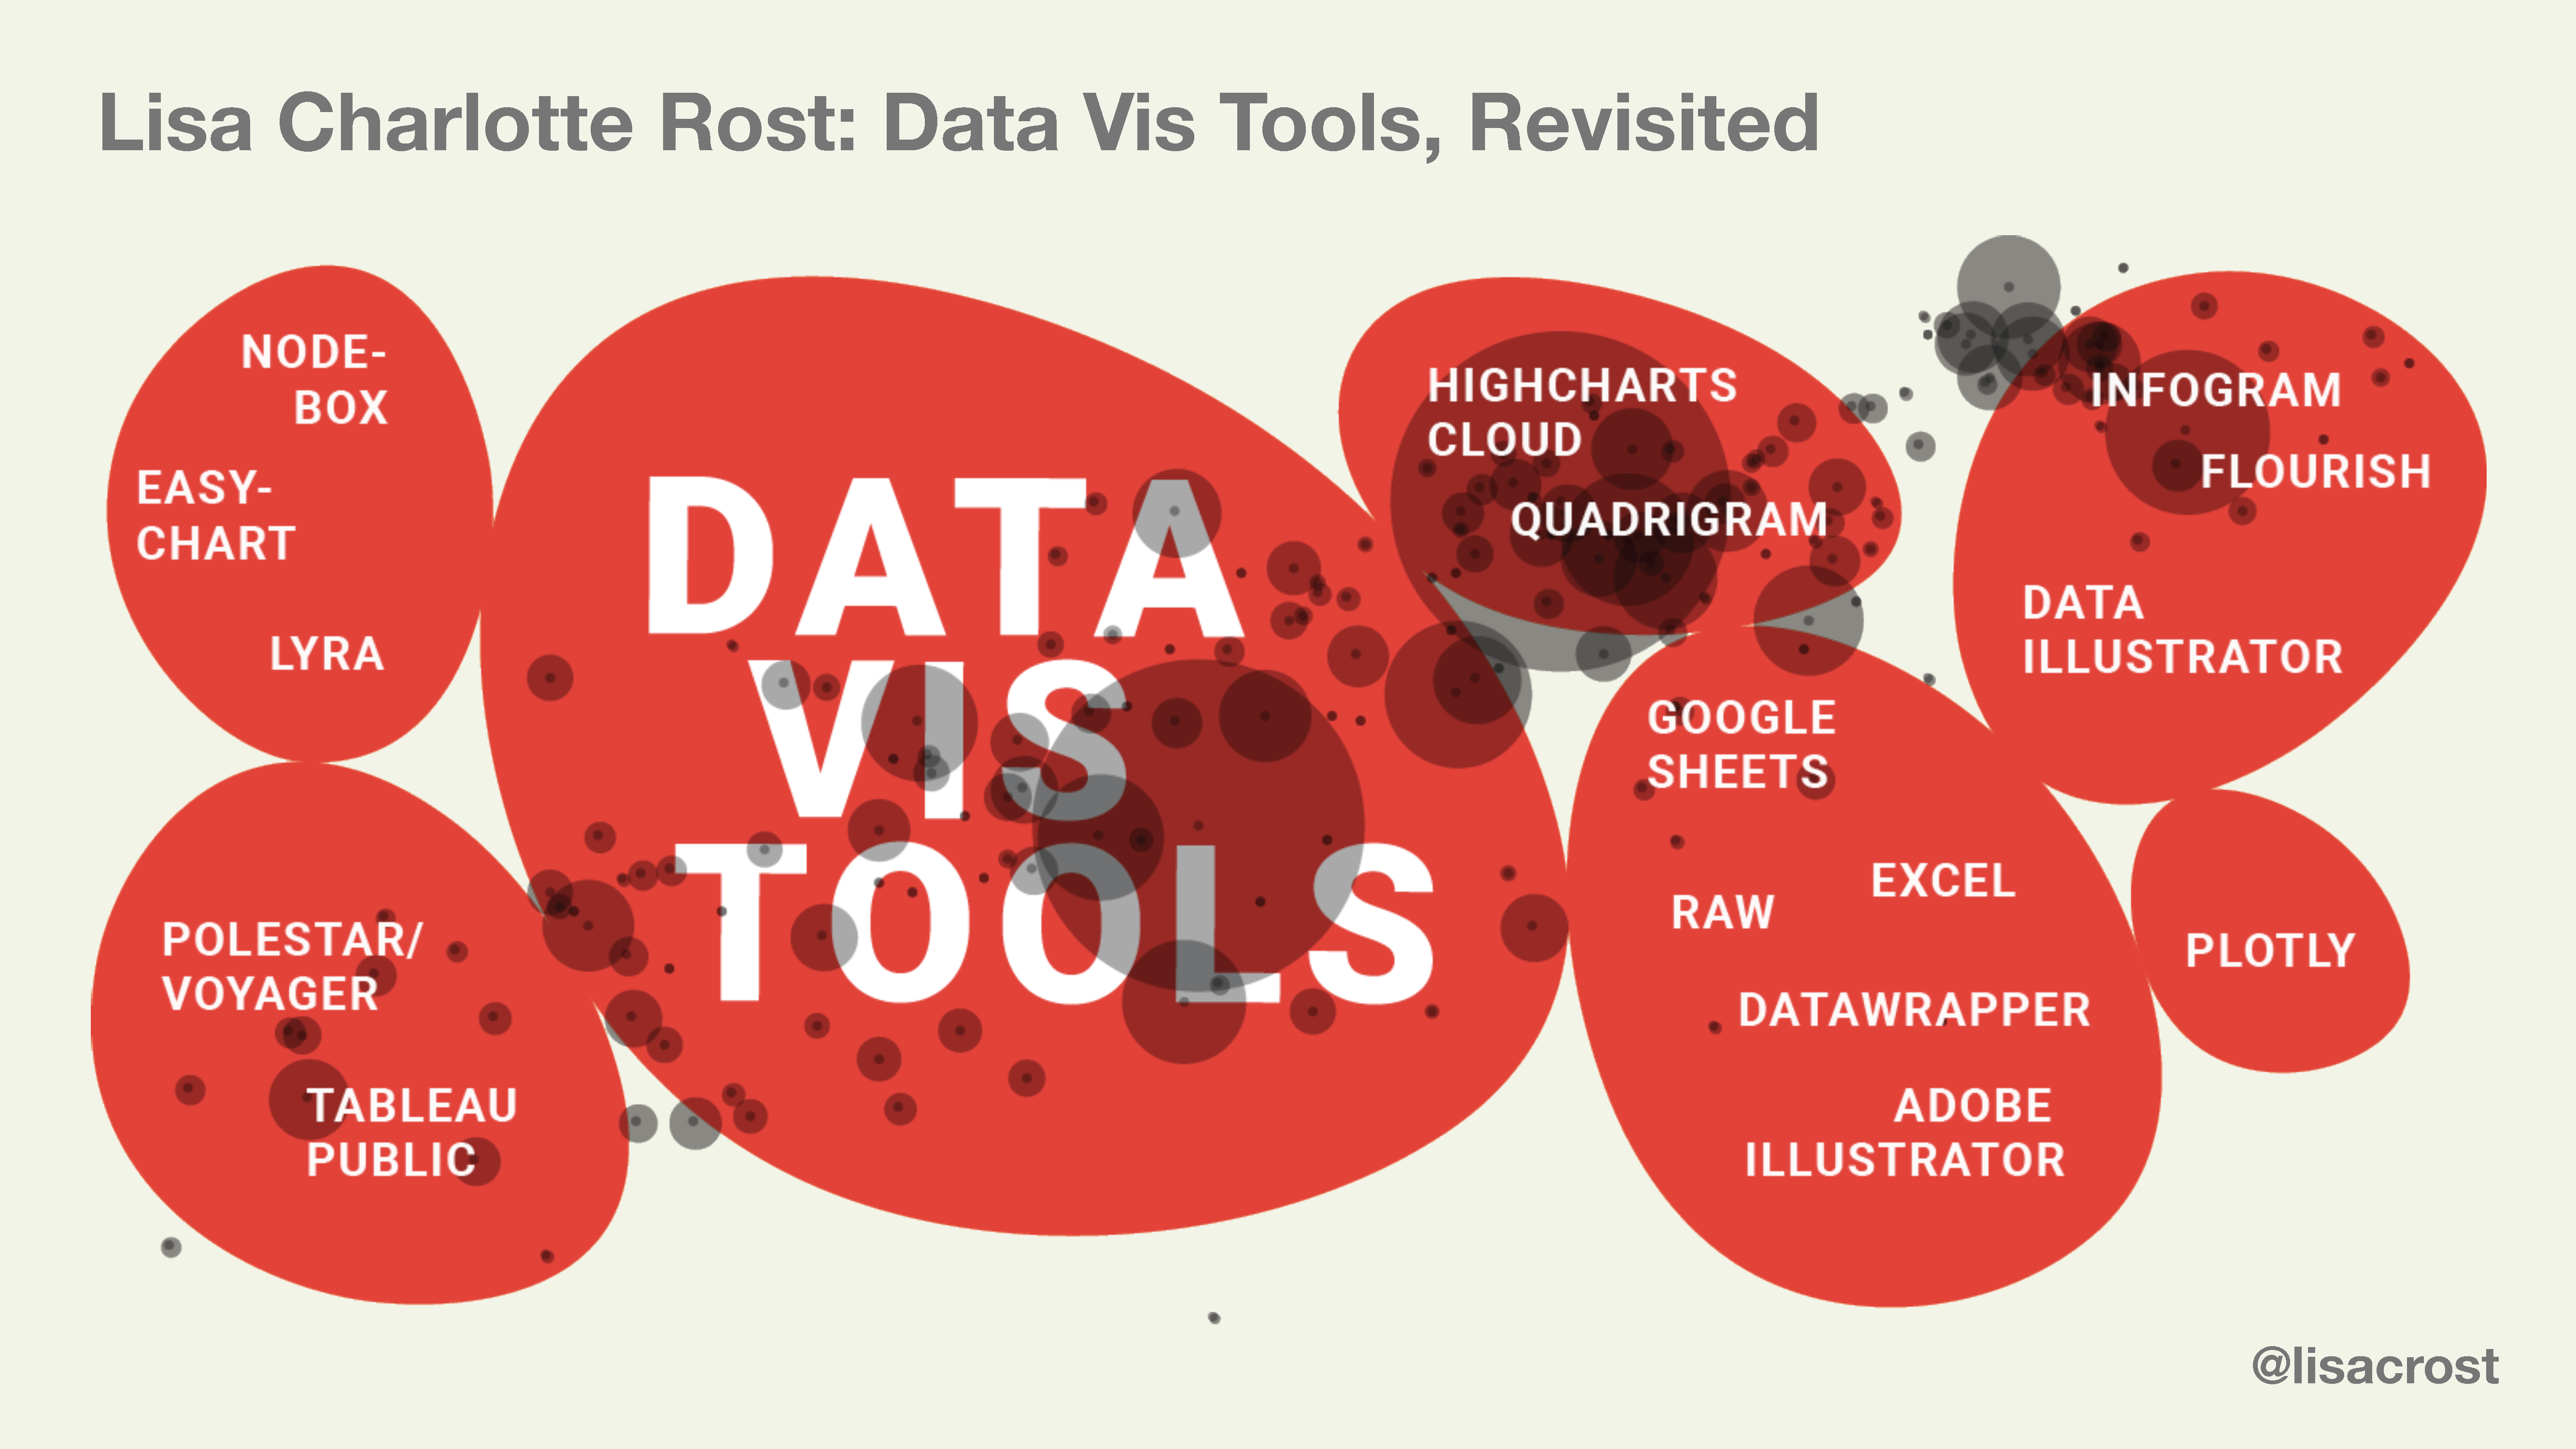
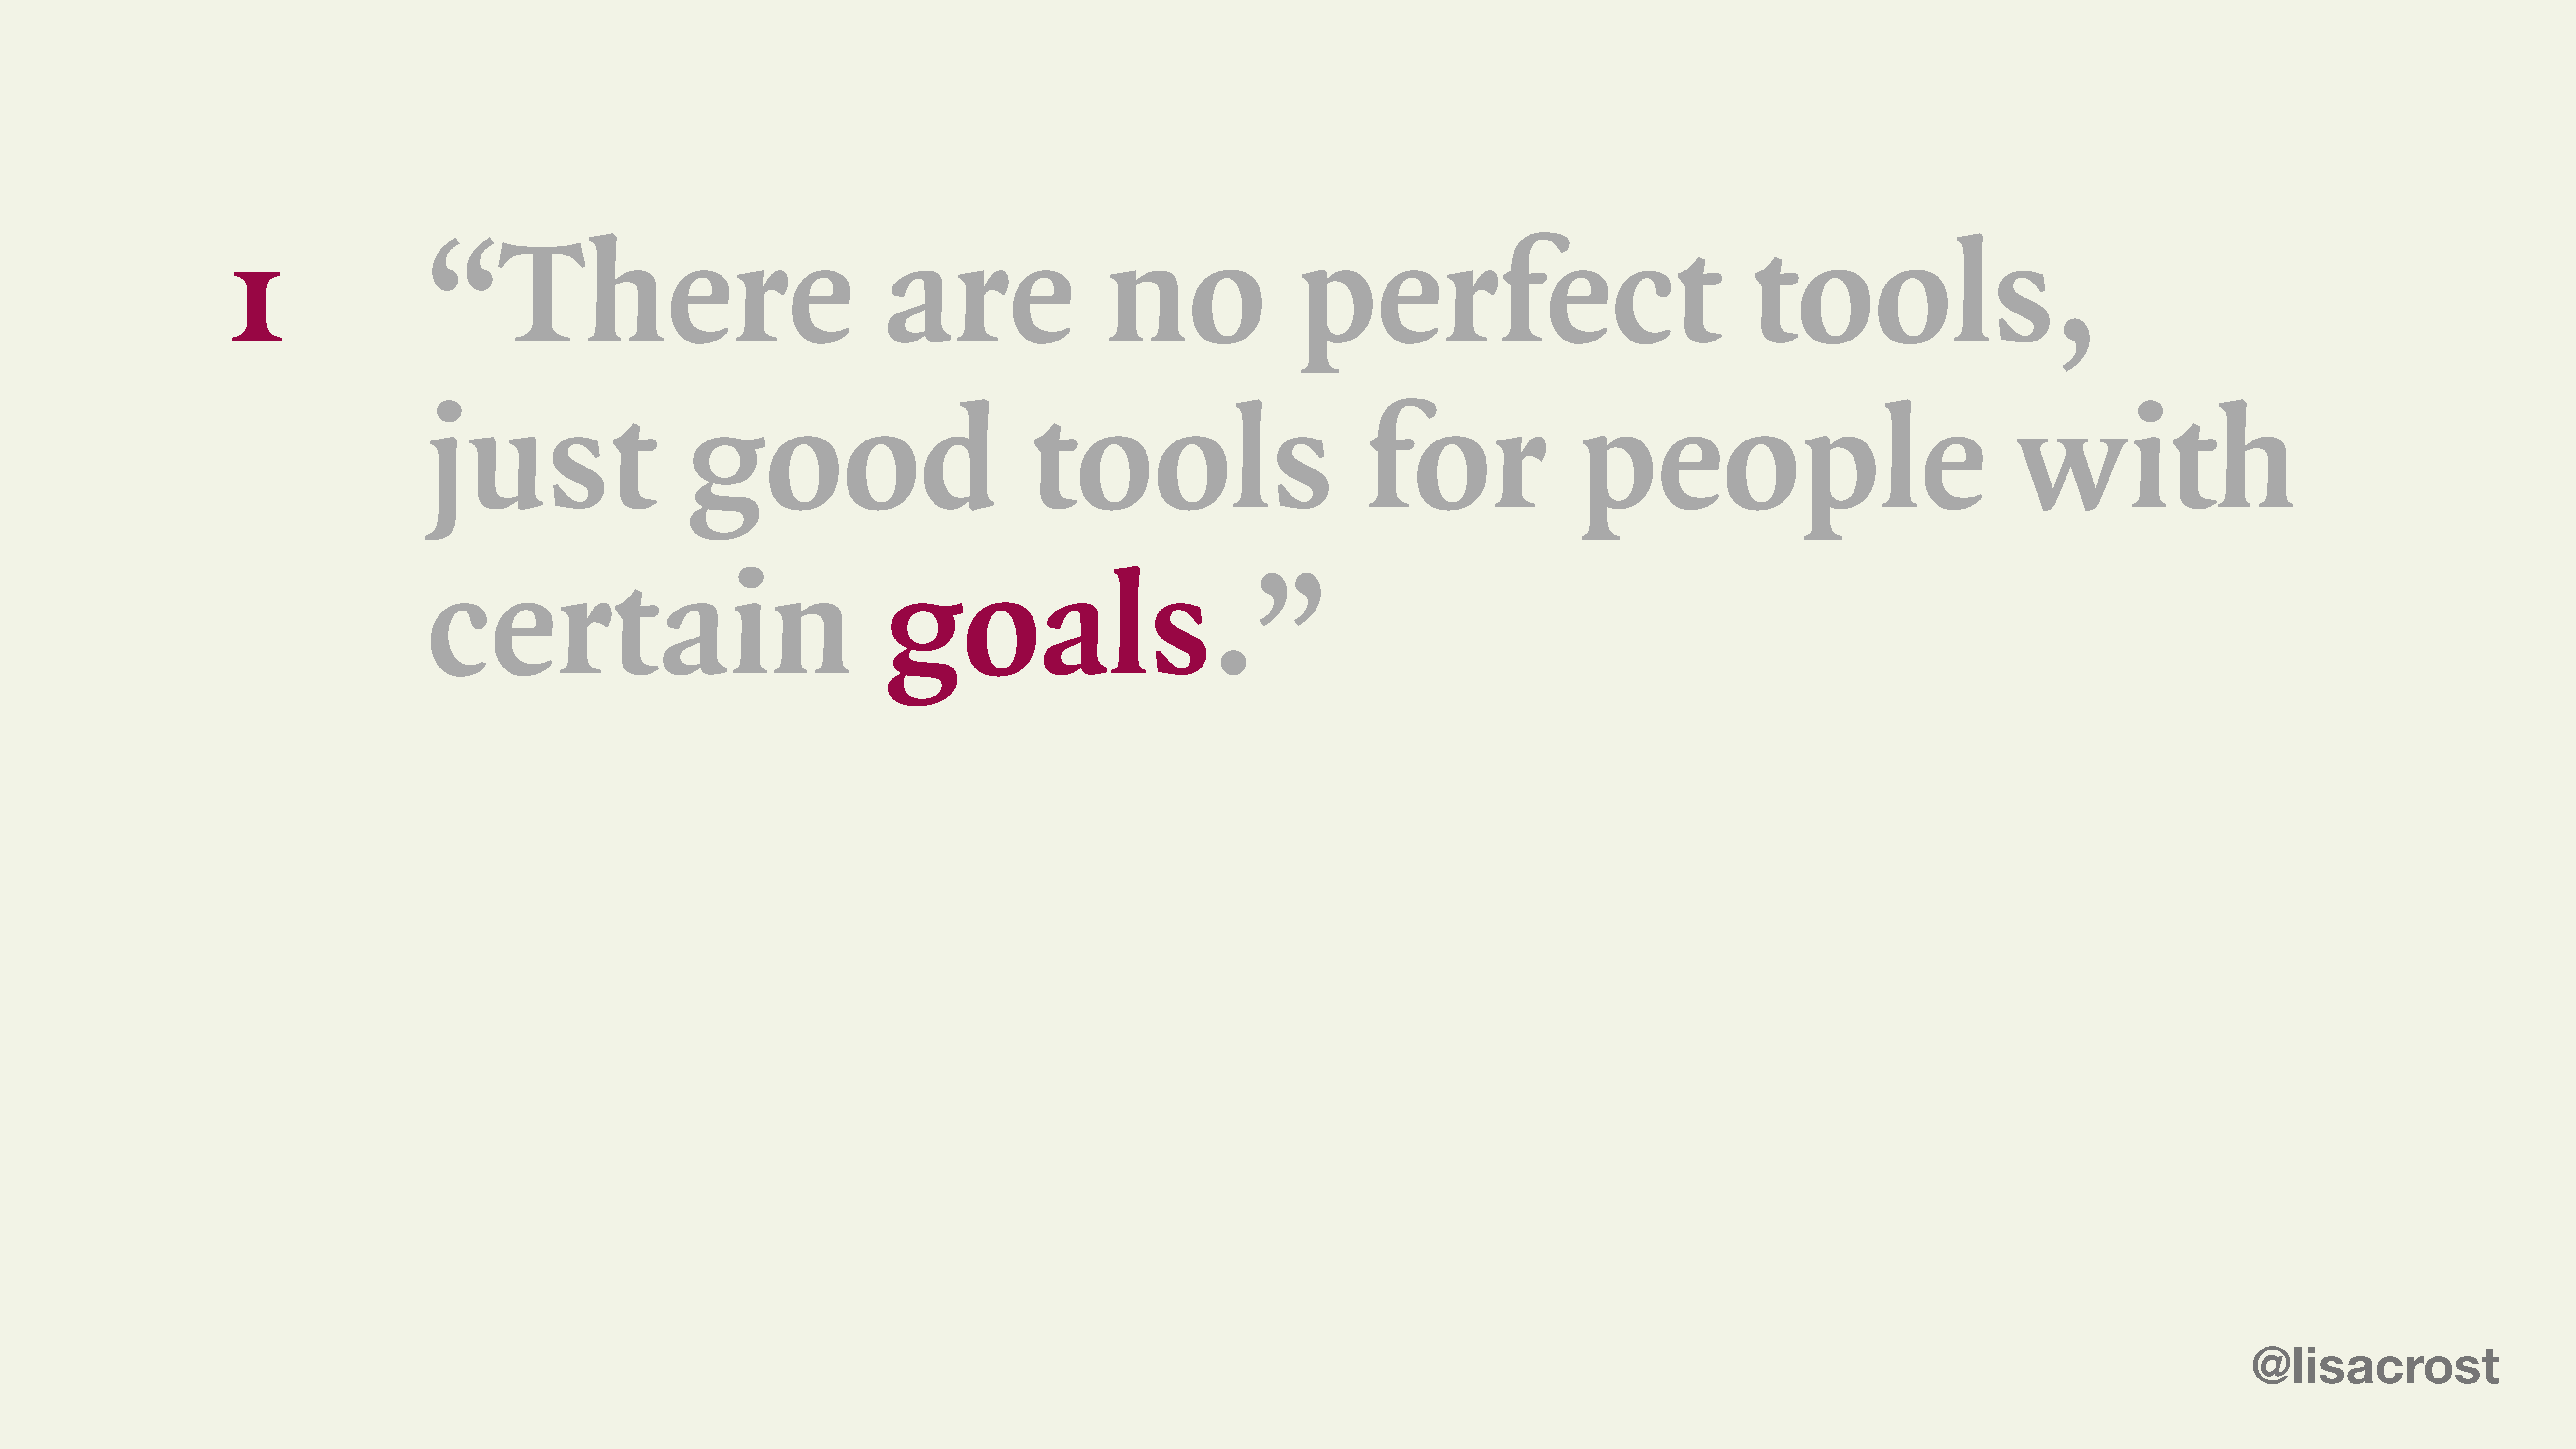
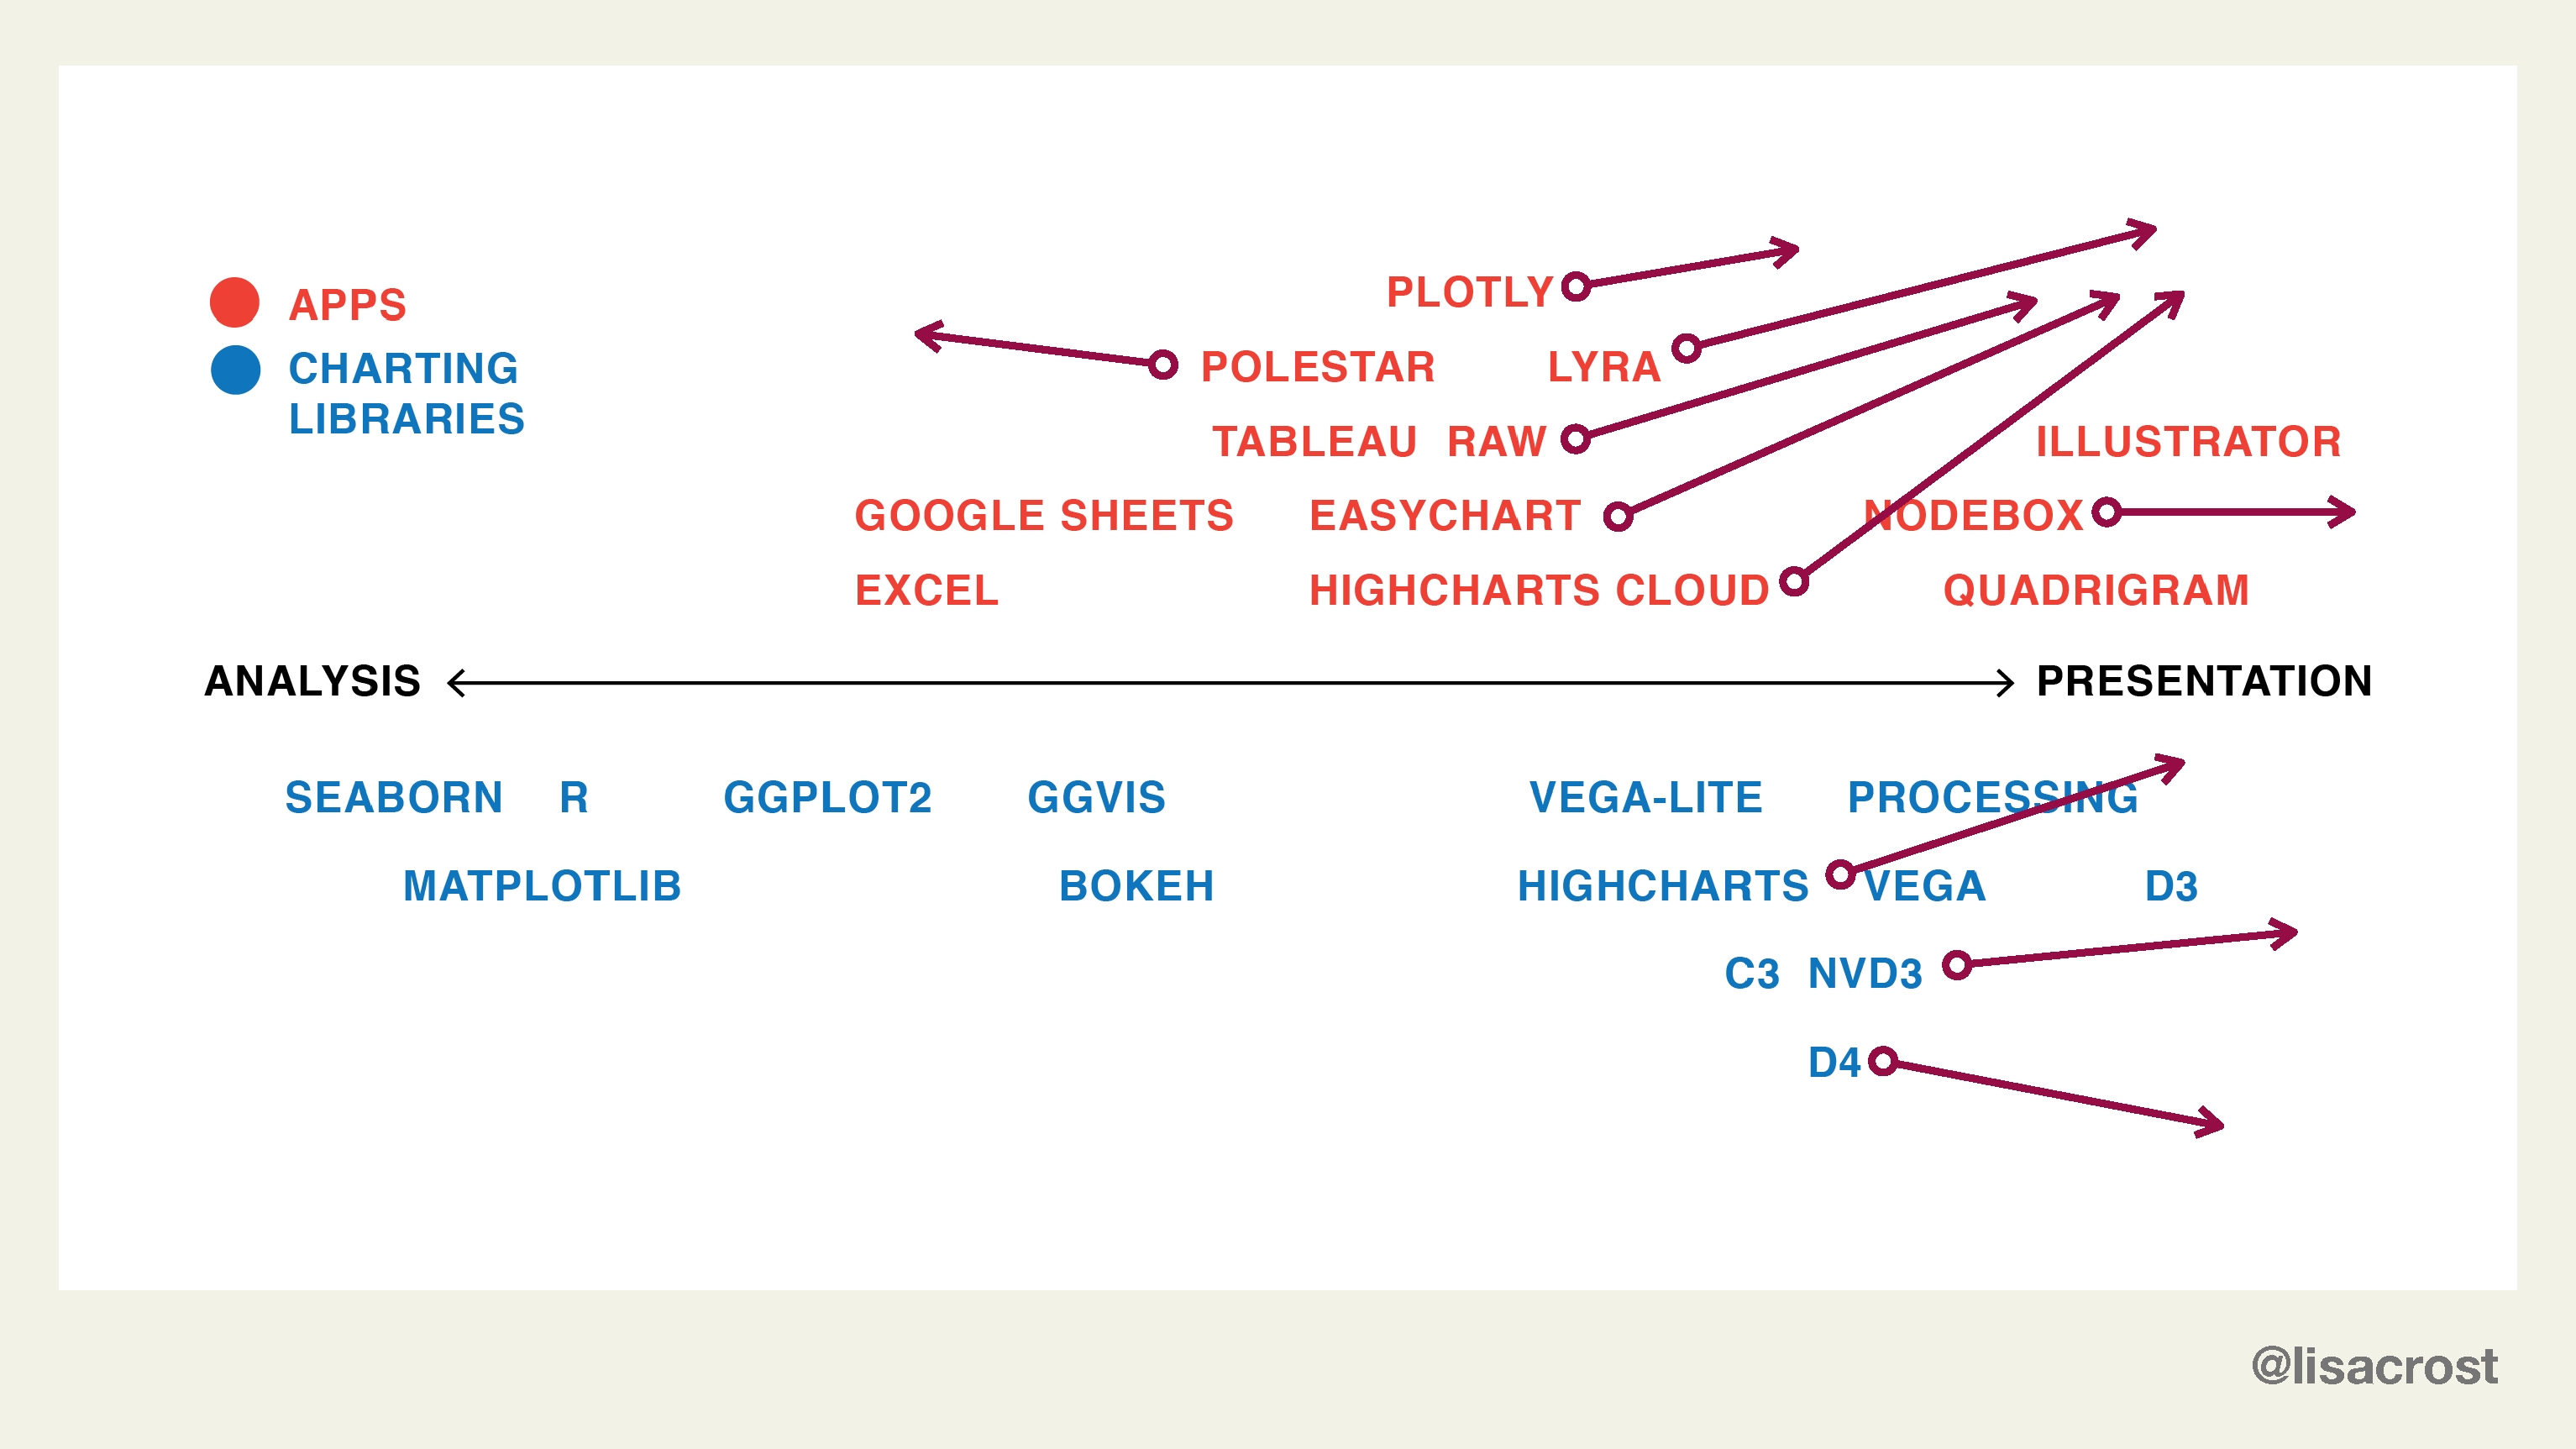
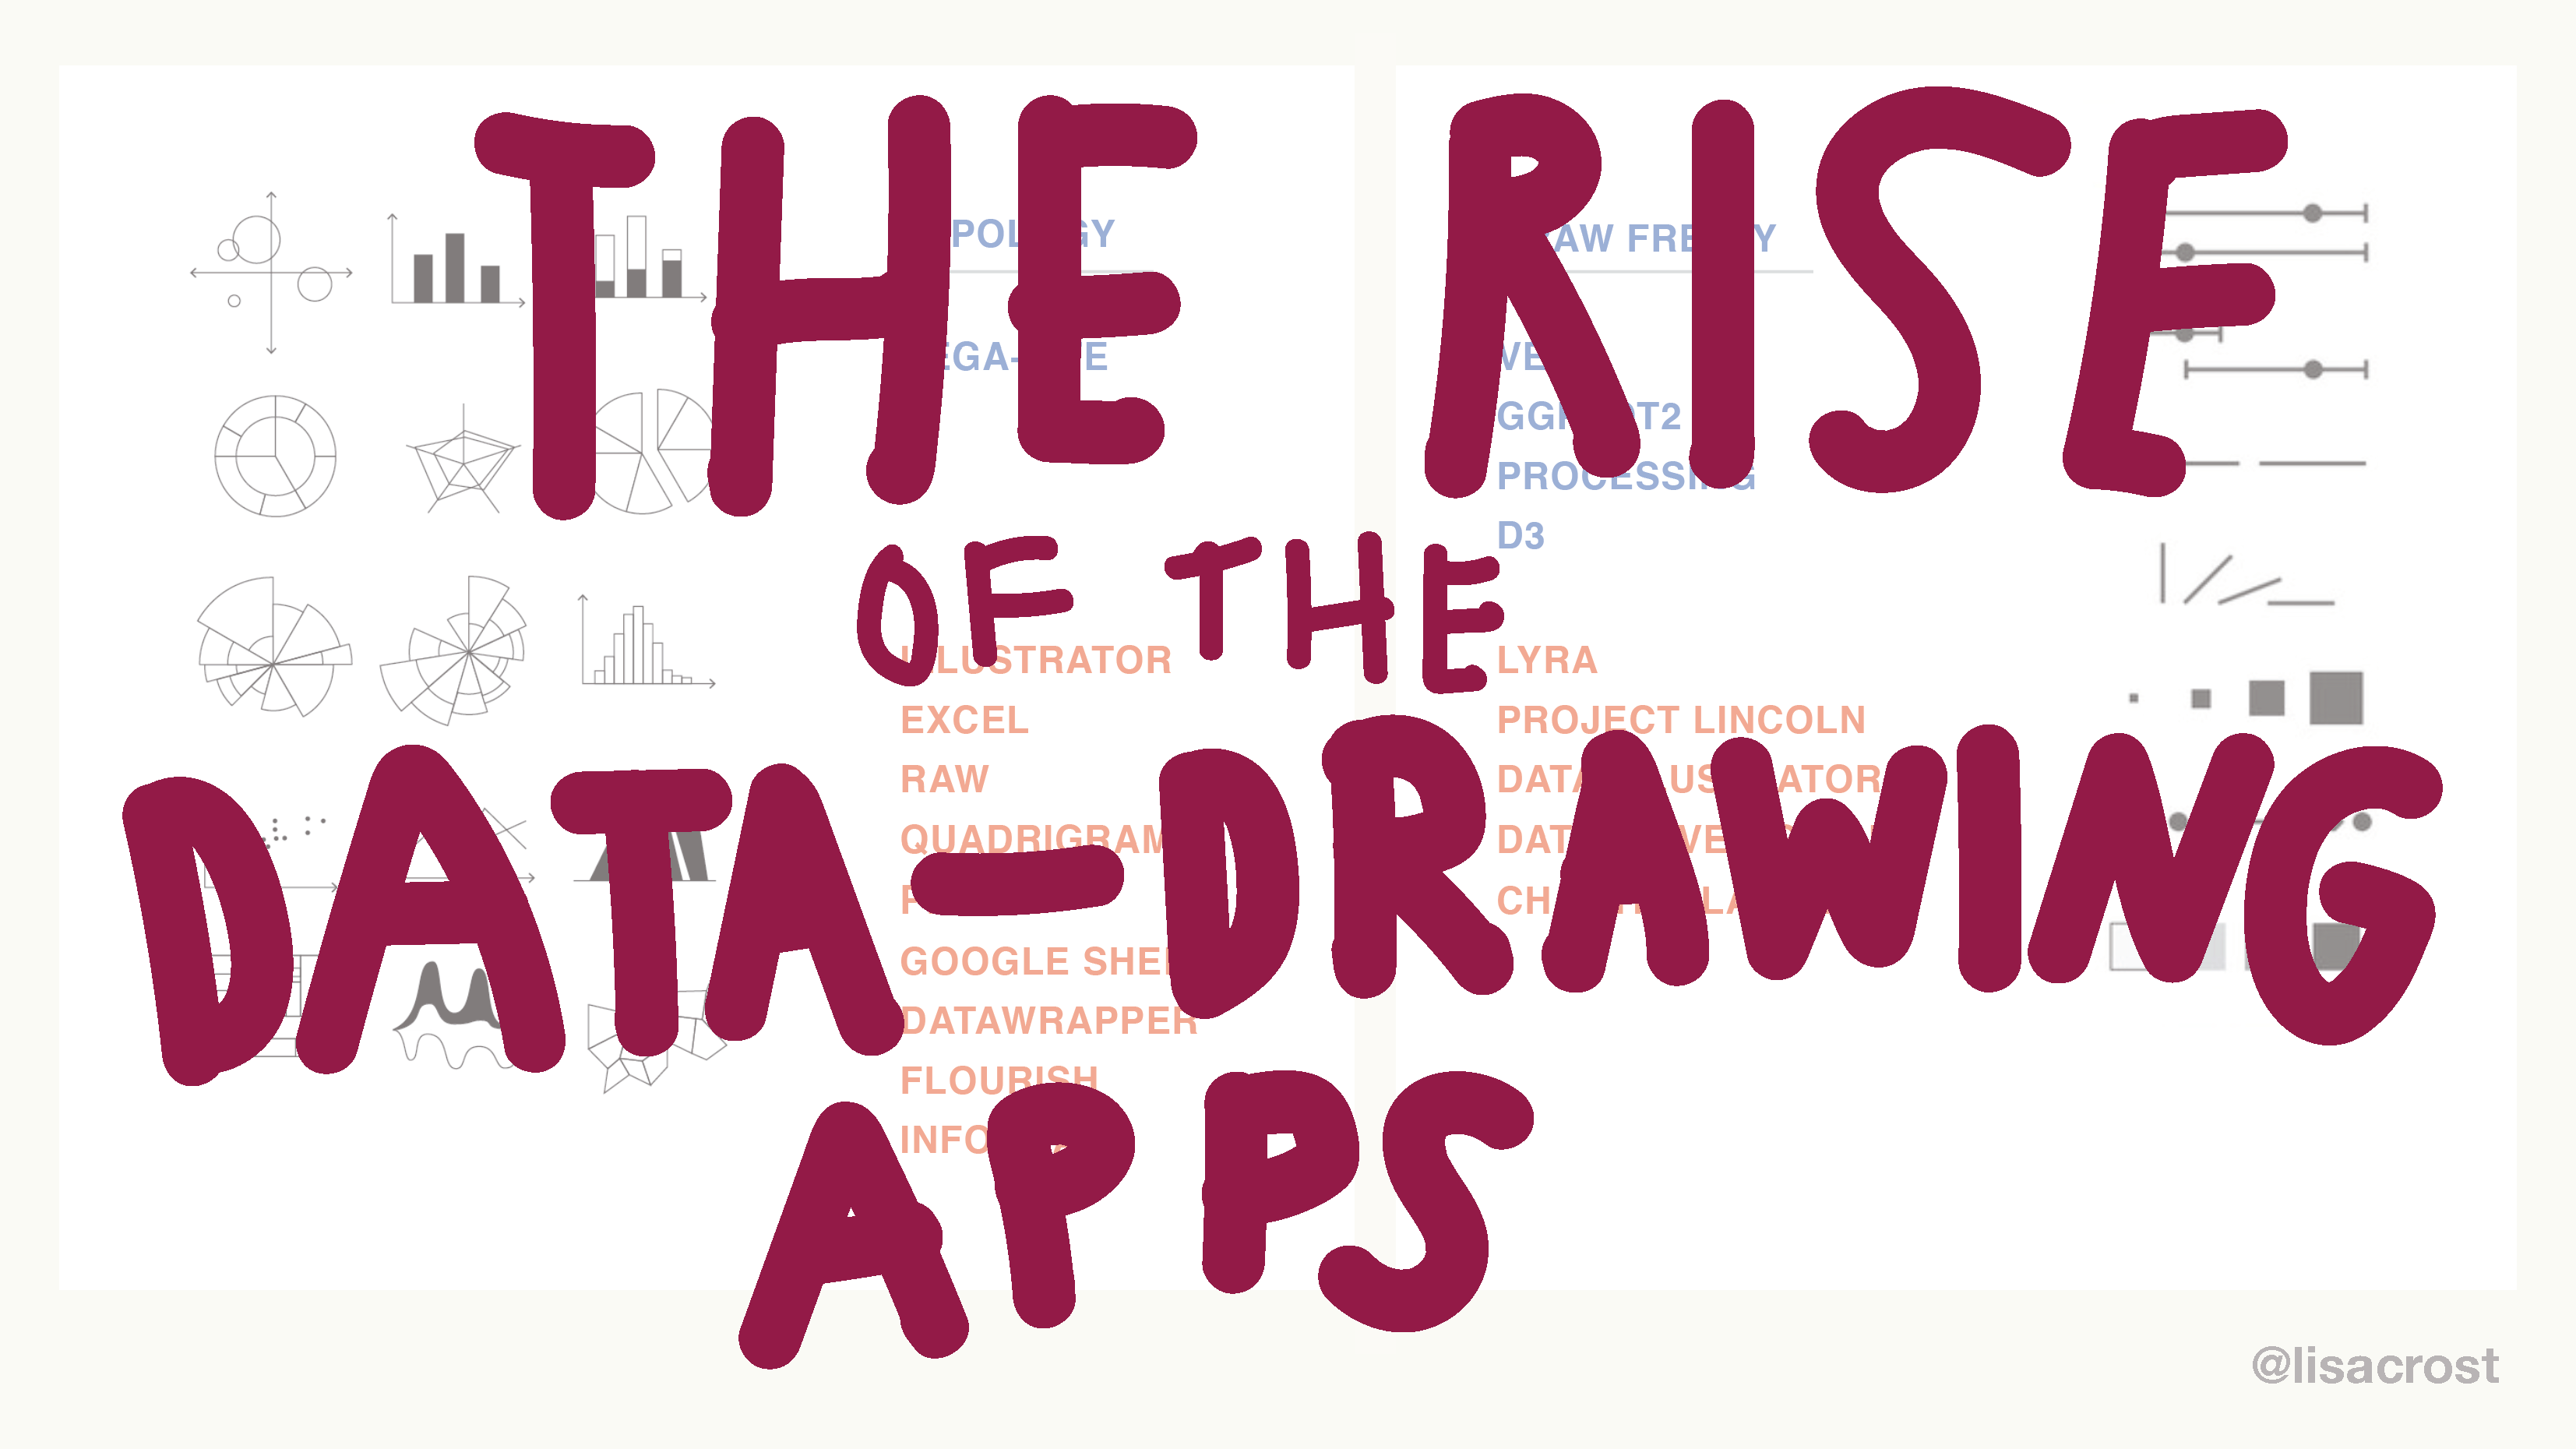
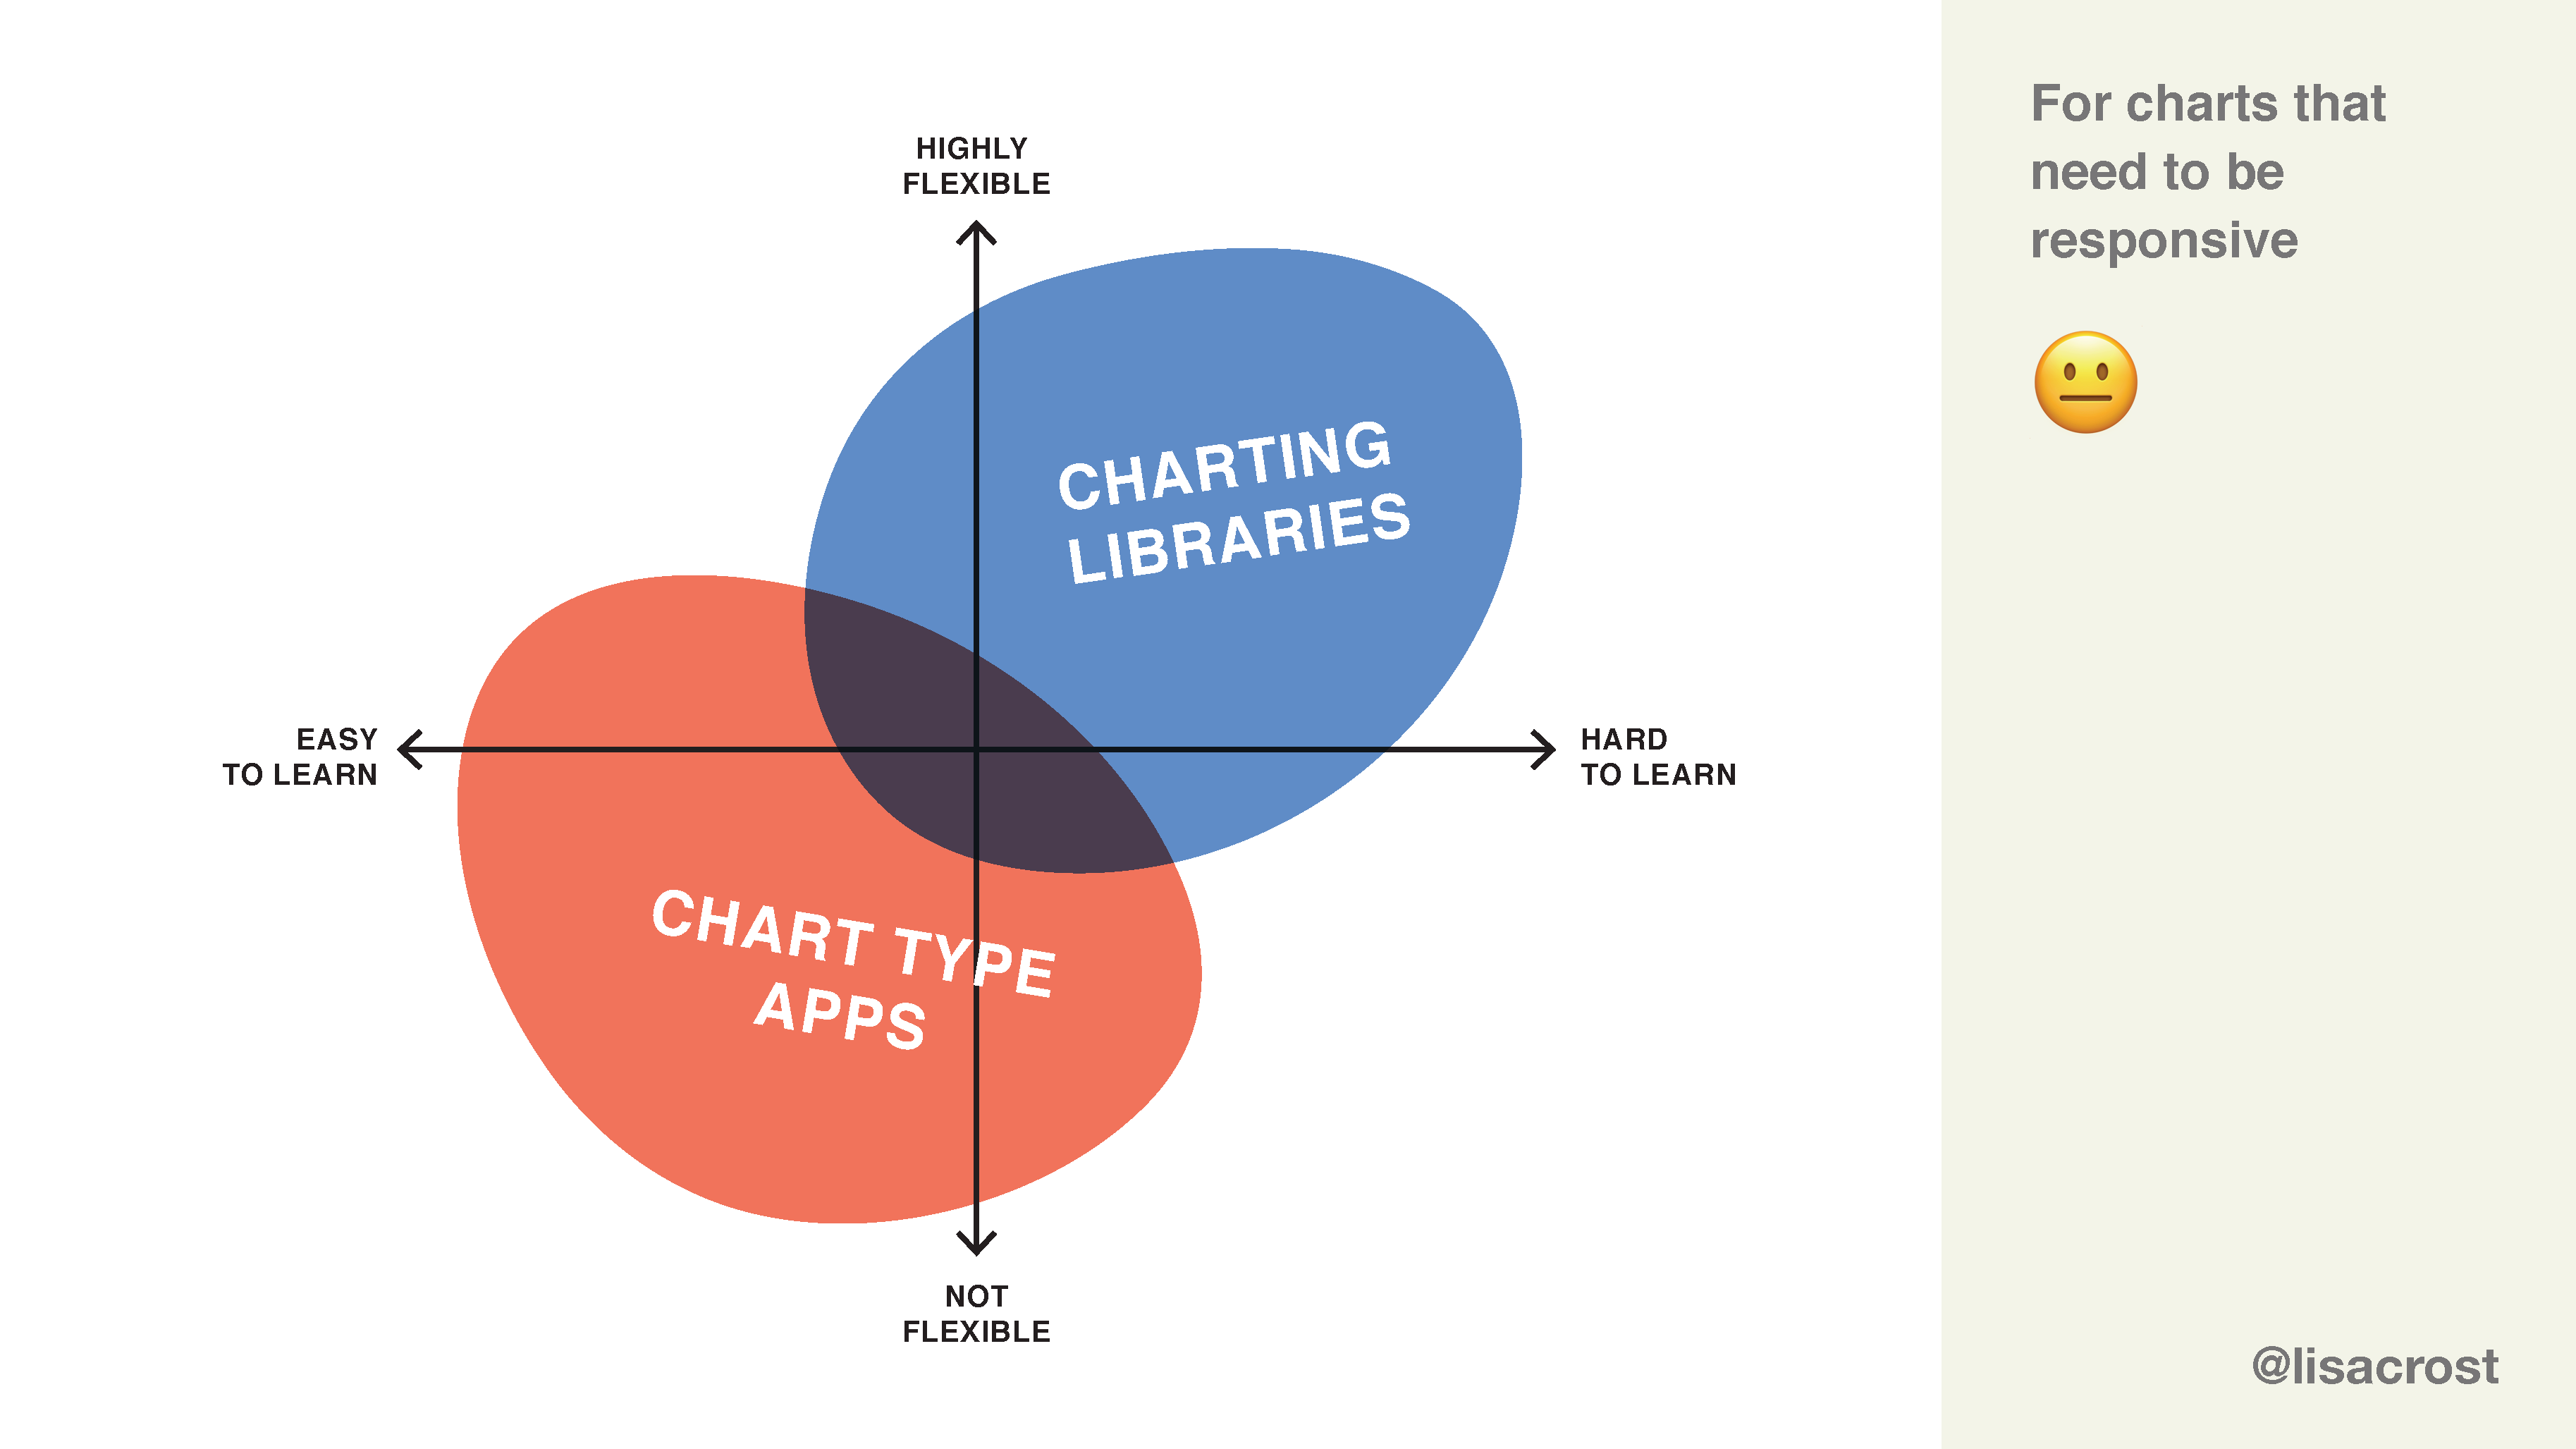
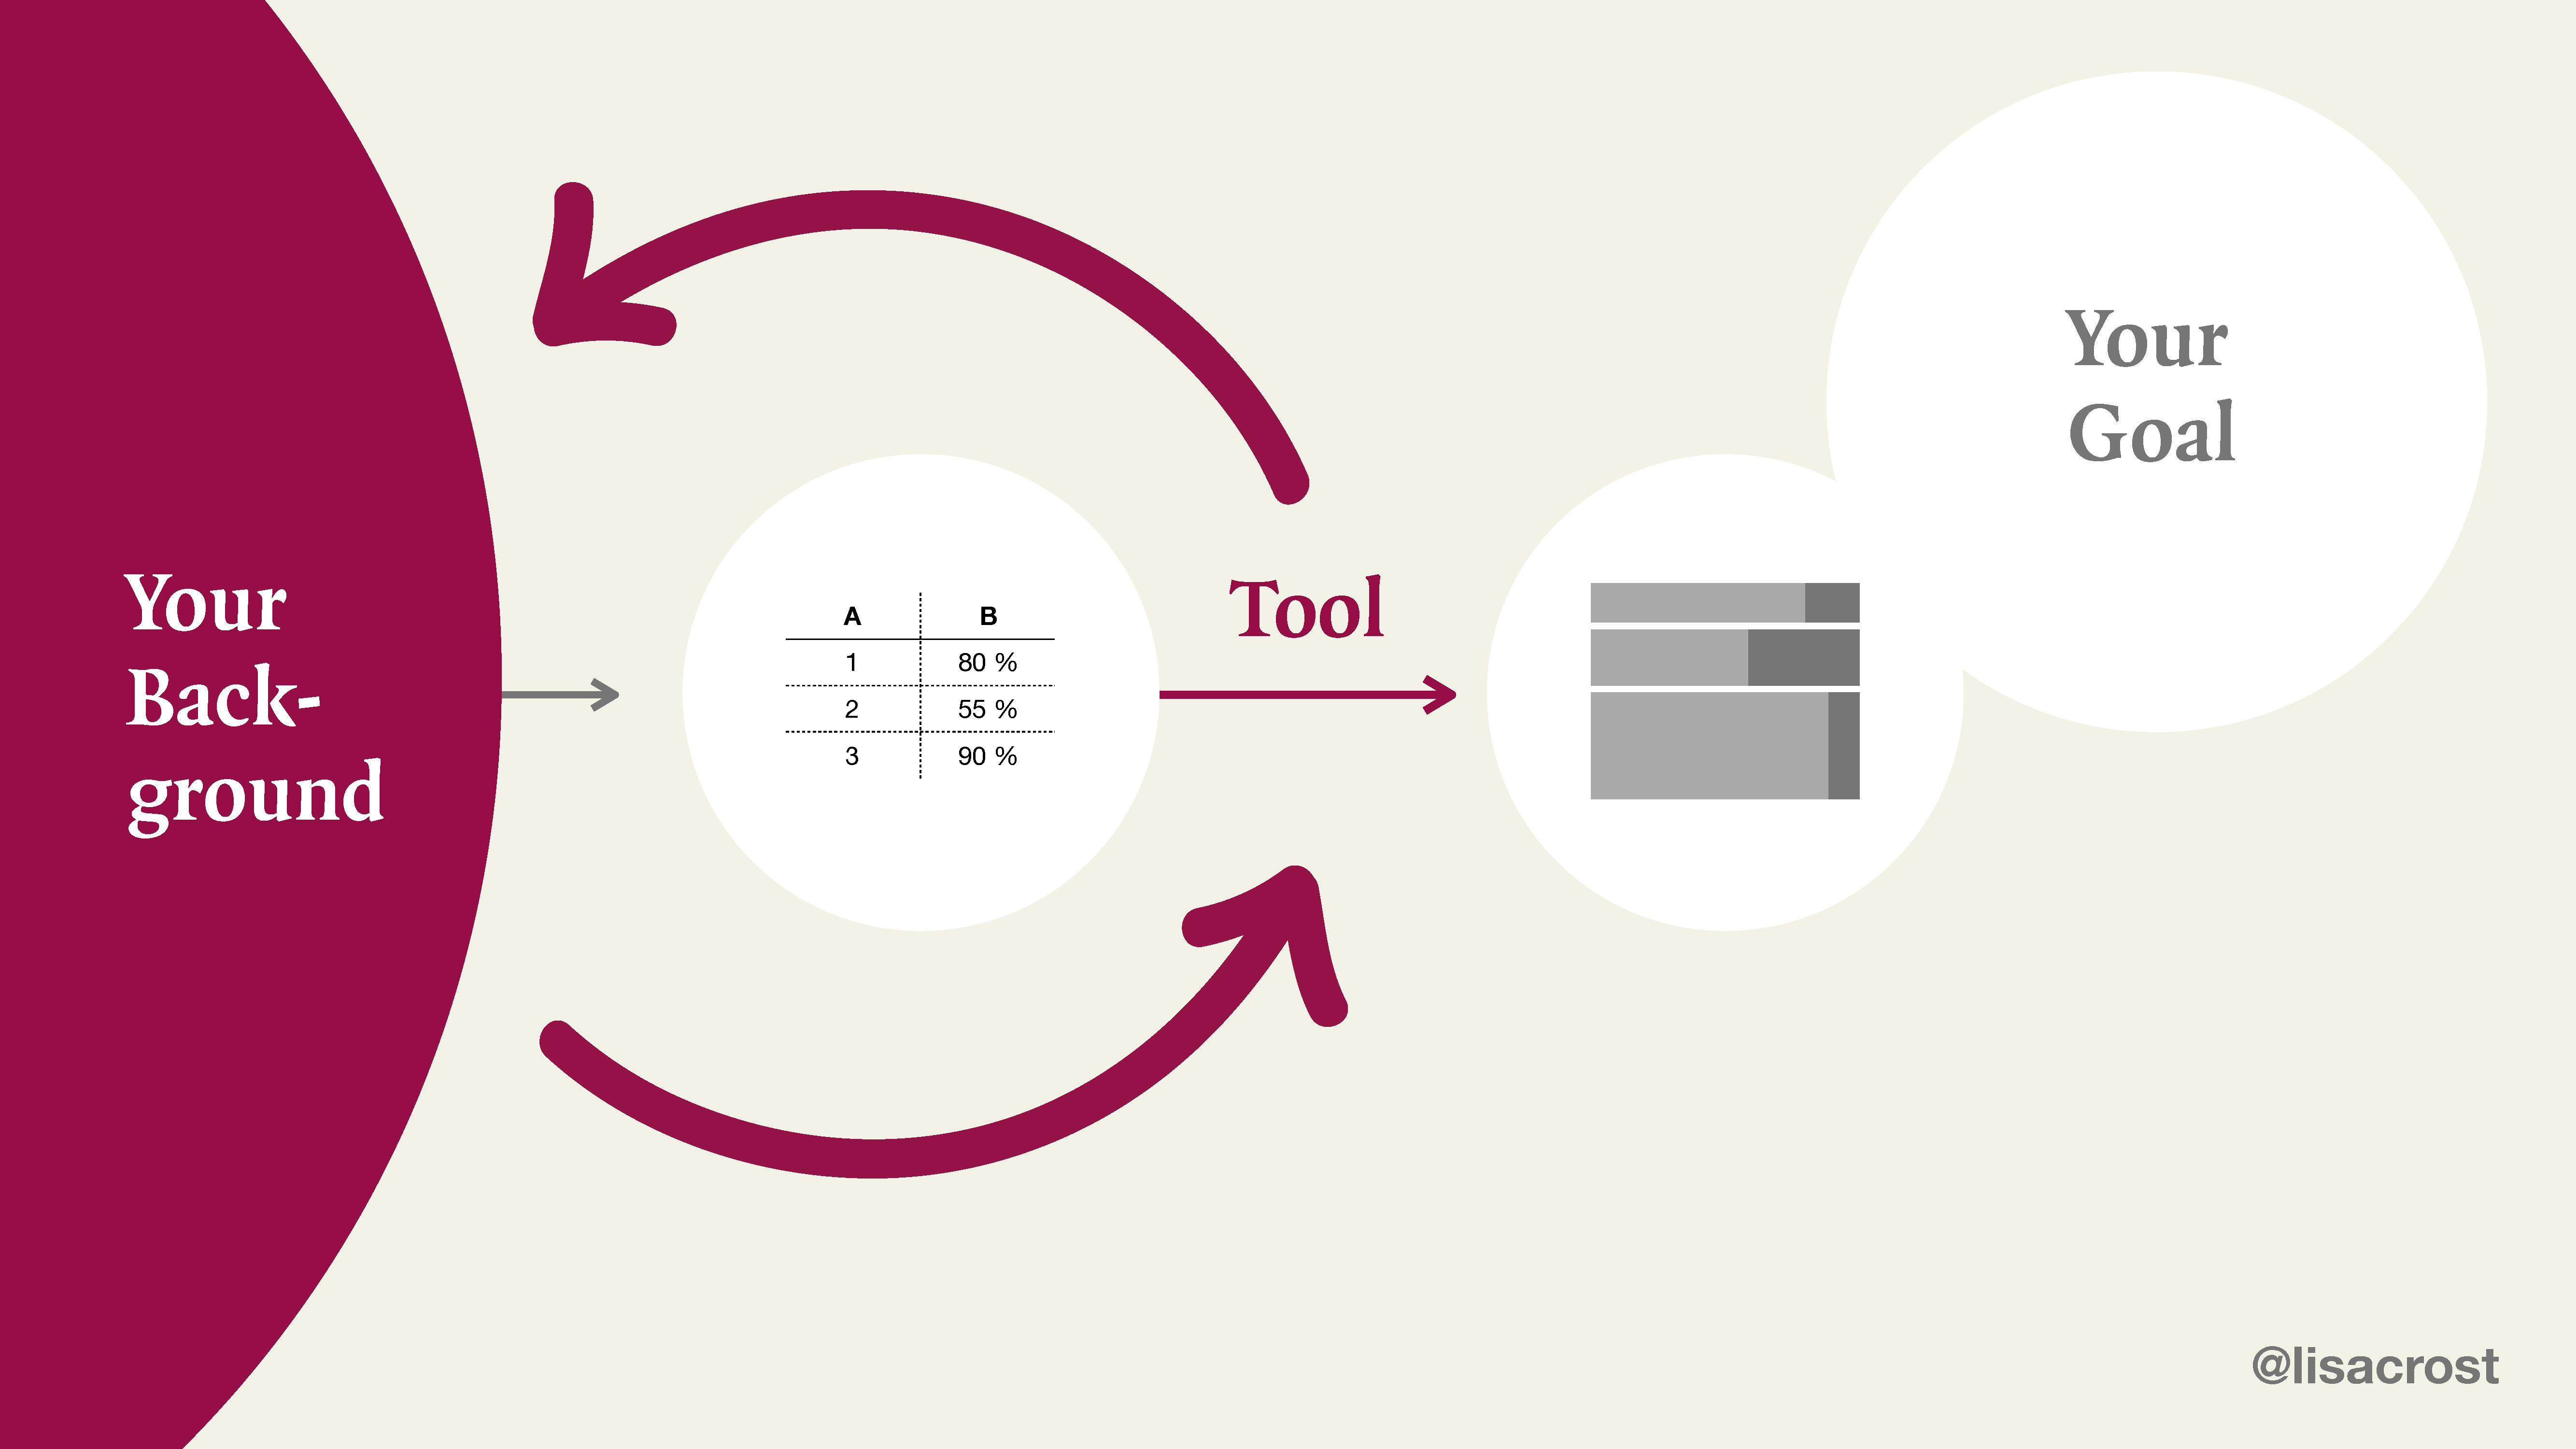
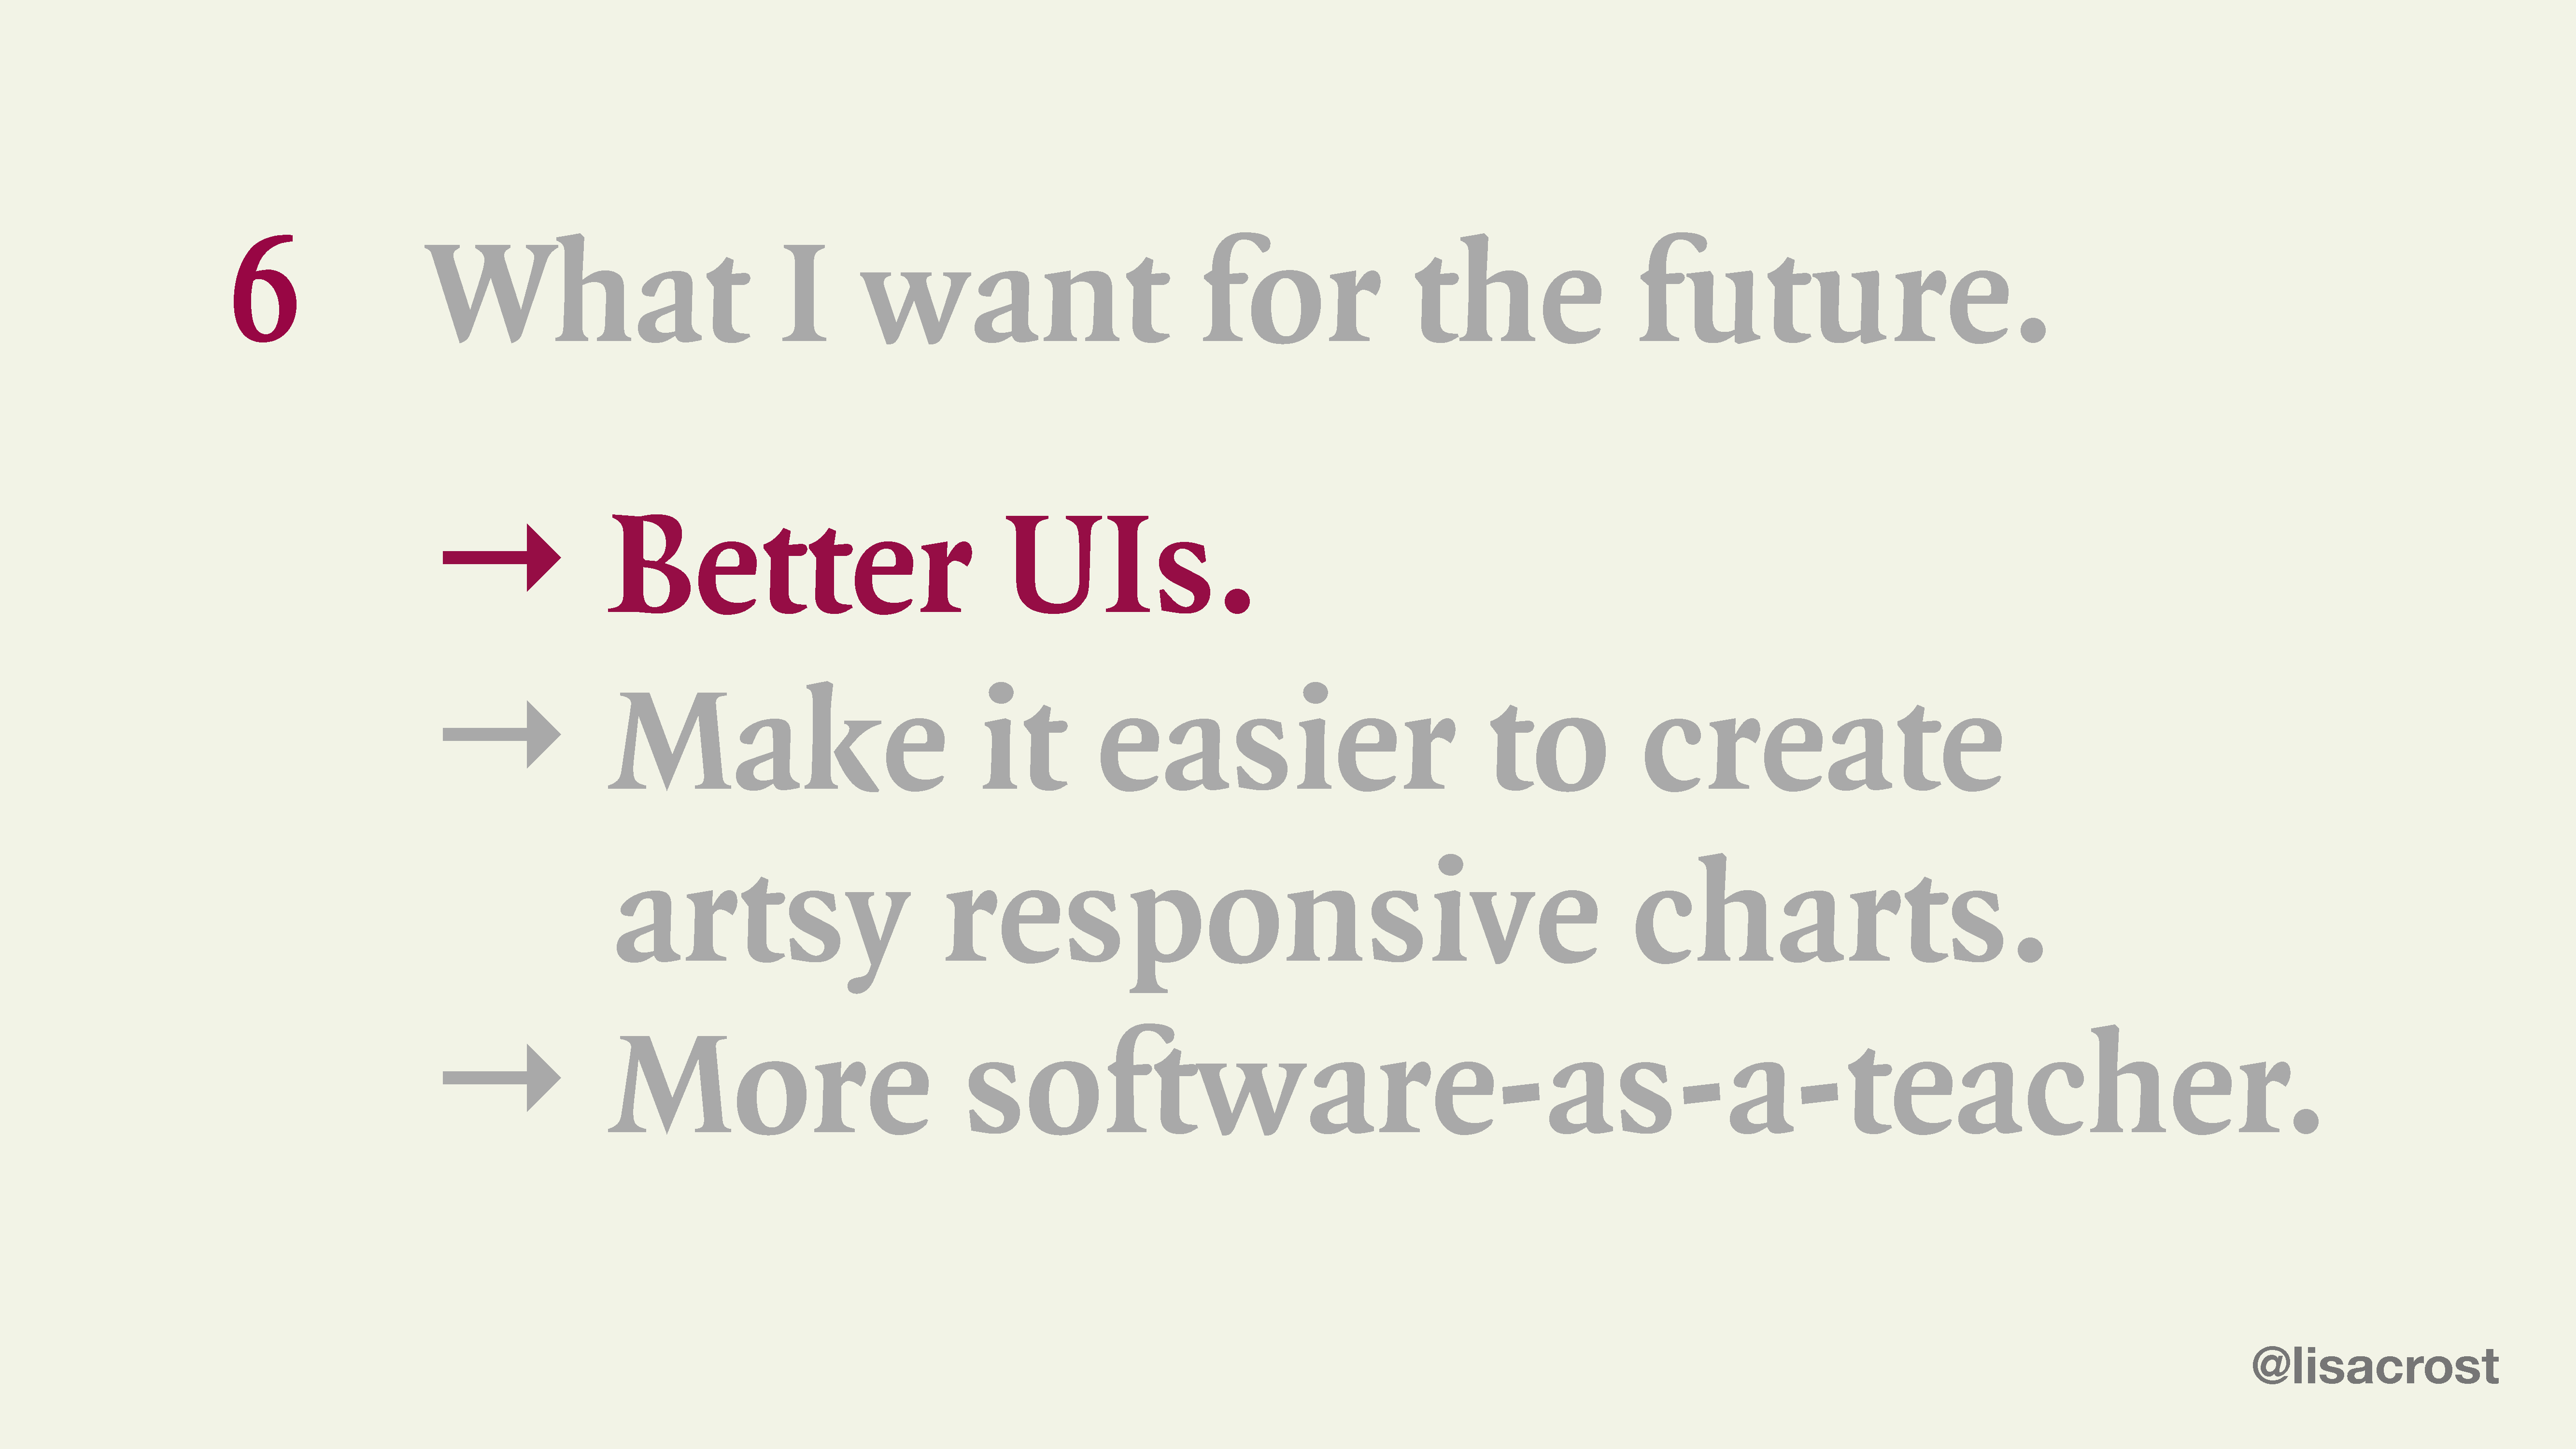
I’m looking back at lessons I’ve learned while recreating the same chart with 24 data vis tools in May 2016 and seeing if they still hold up. I also introduce new developments in the tool landscape (“the rise of the data-drawing apps”), build empathy for tool builders and talk about my wishes for the future.
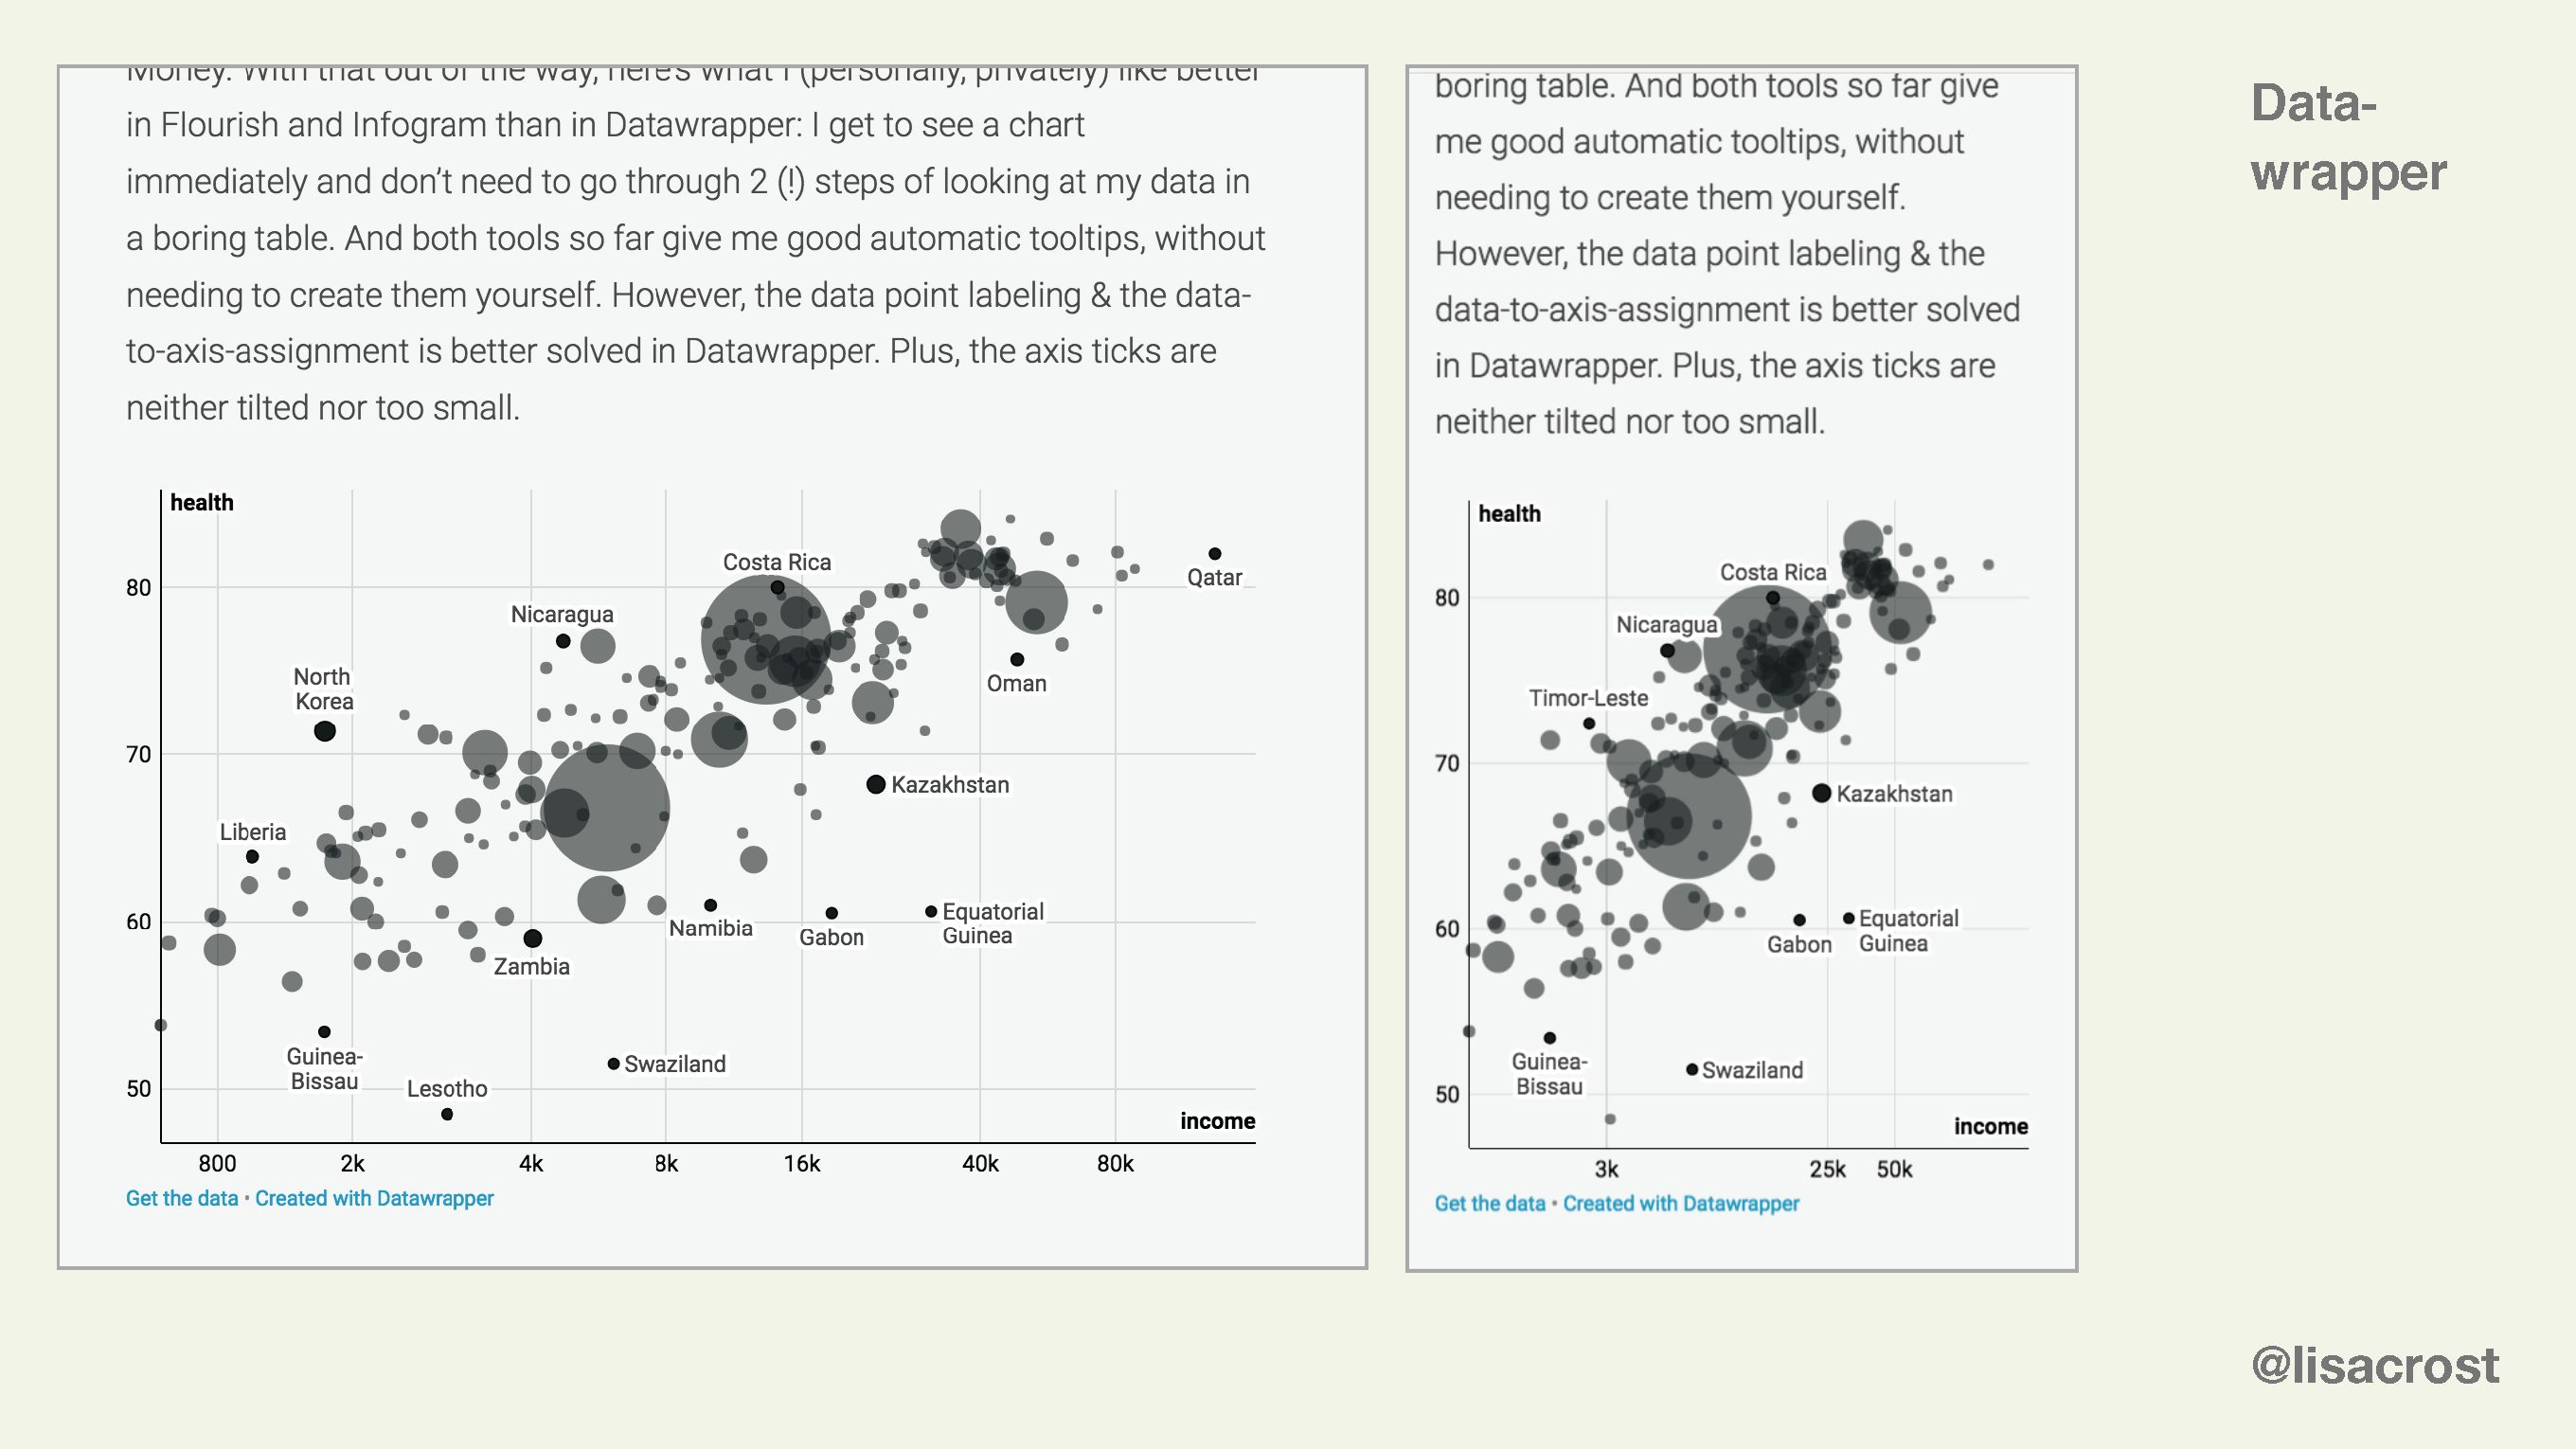
A week before giving the talk, I also released an update to my original blog post, comparing nine different data vis tools with fresh eyes. You can find it here.
Here I just show a selection of slides from the talk. To download the complete PDF, head over to this Github repo.