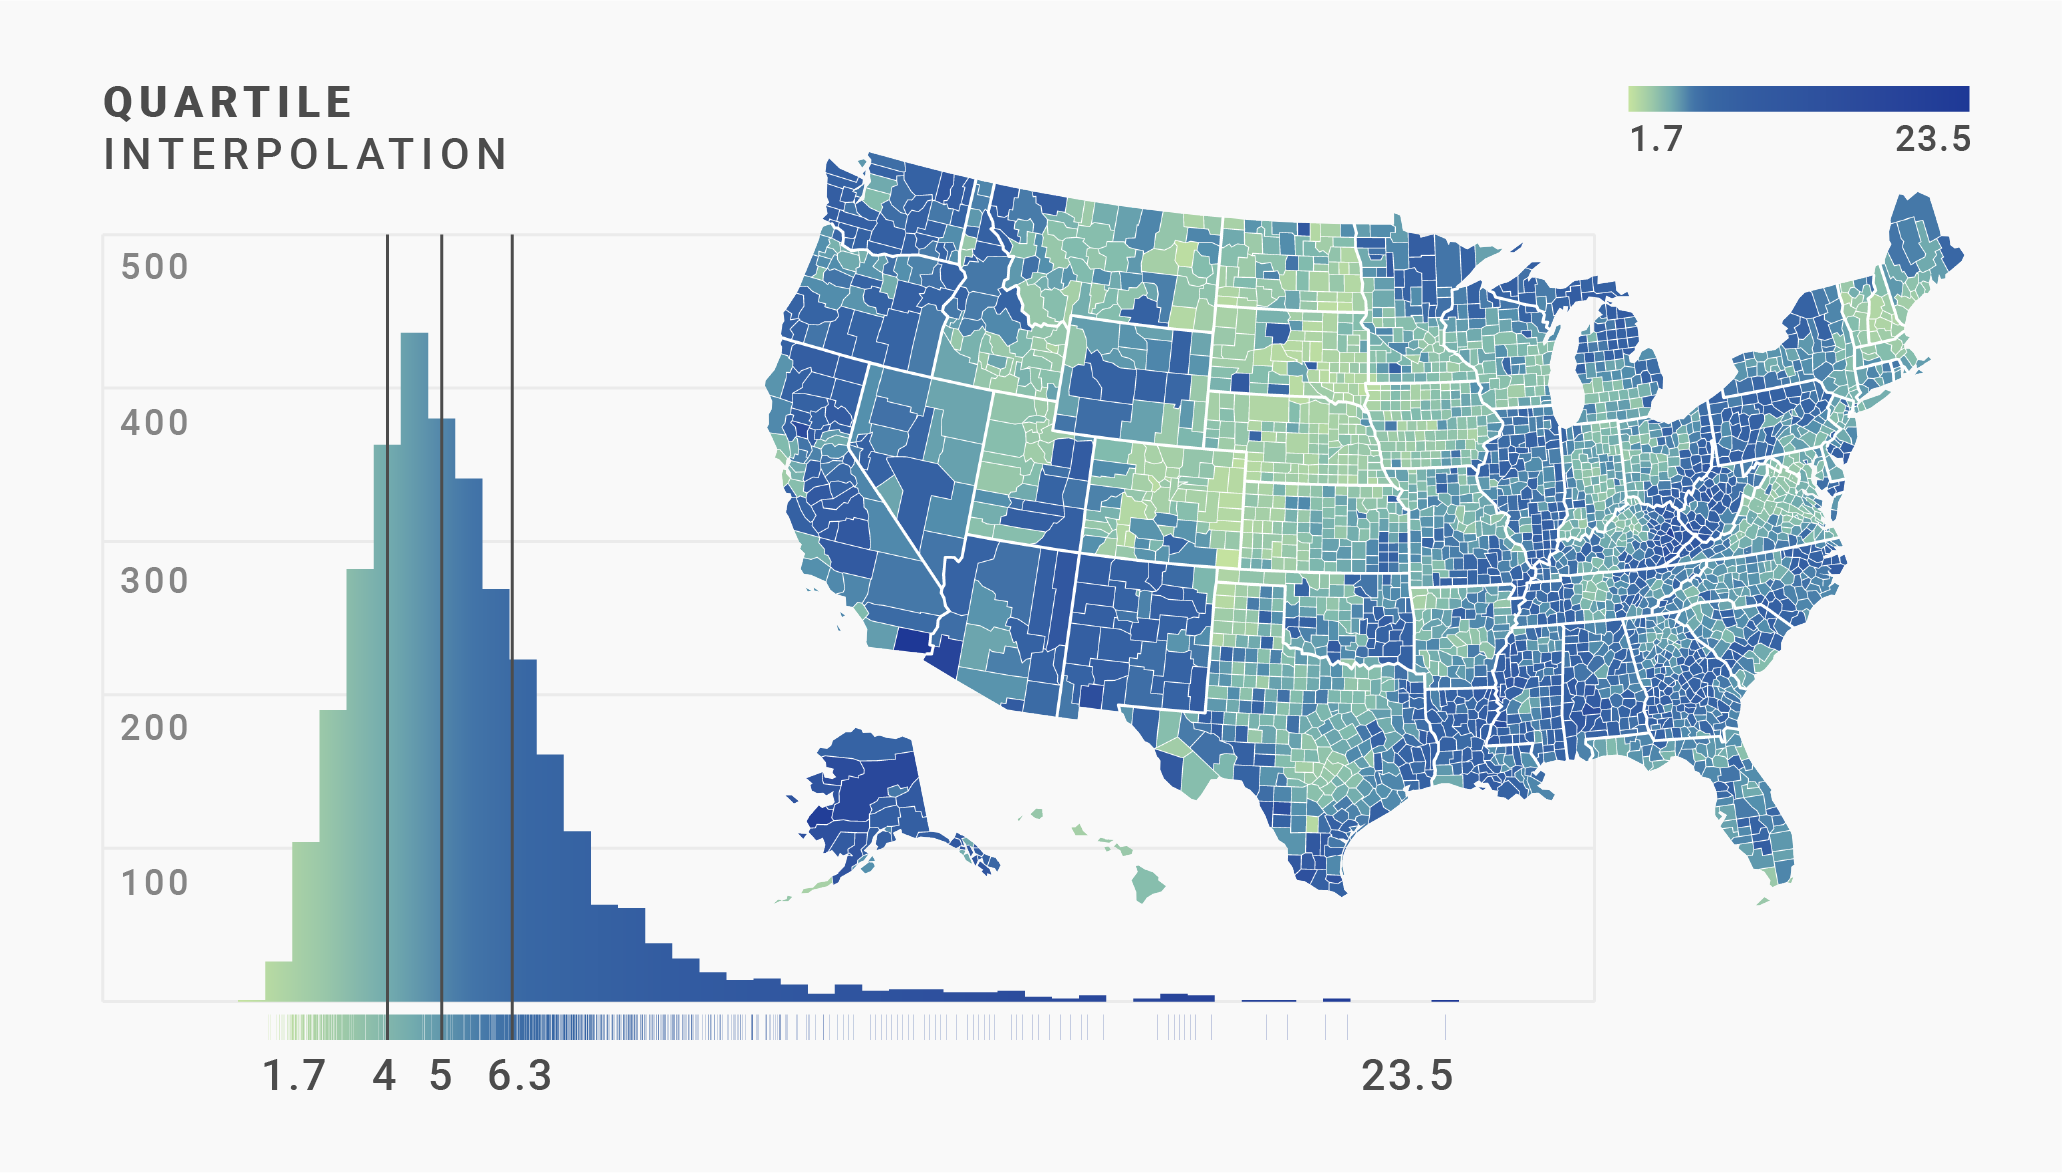
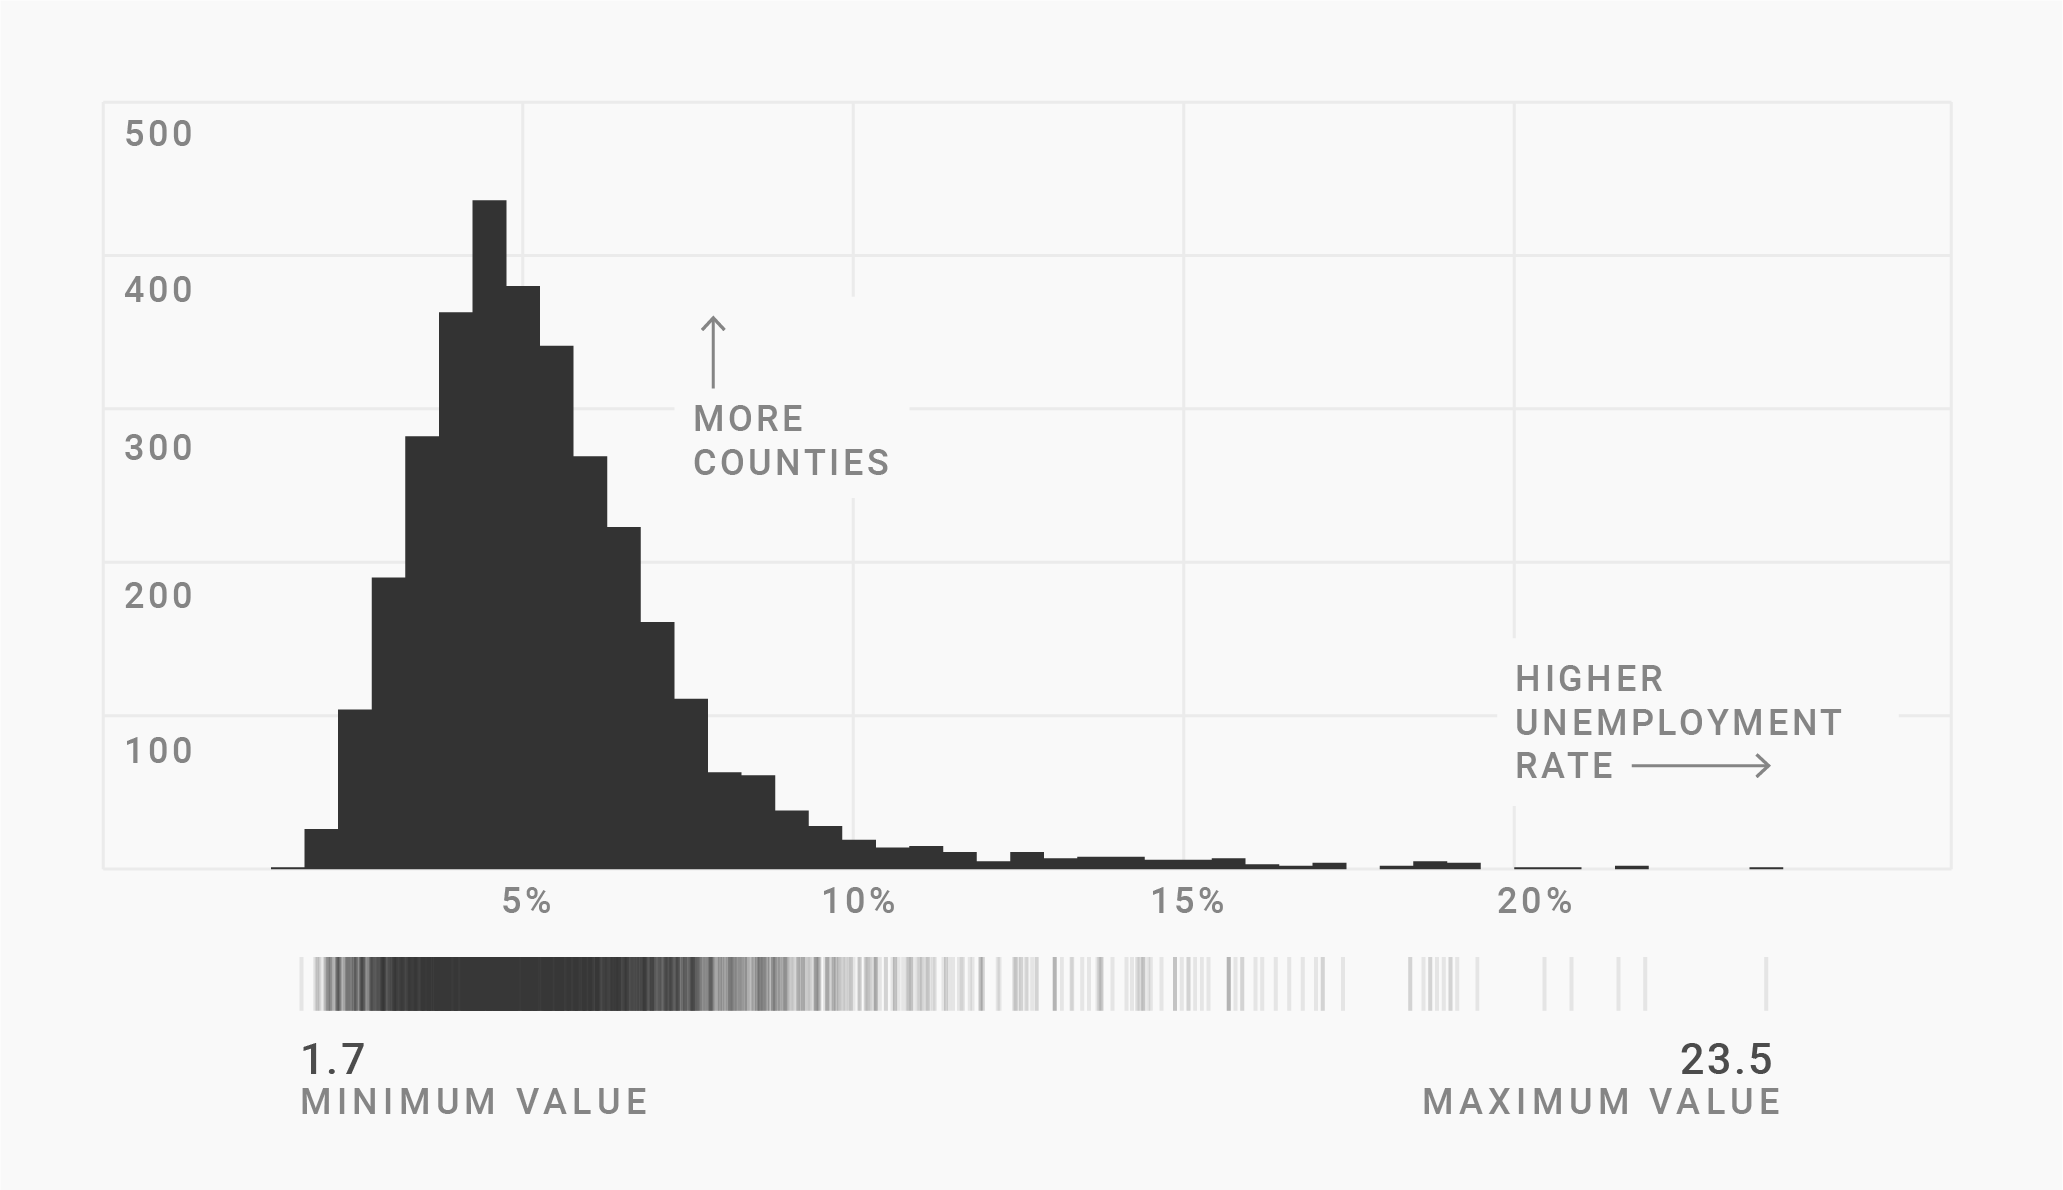
Today was as good as I hoped. I found a new layout for the figures in the interpolation chapter that I’m fairly happy with. It shows the histogram of the values, the percentiles (up there: quartiles), and the resulting map.
And I almost got all of them done for both continuous and stepped/classed gradients:
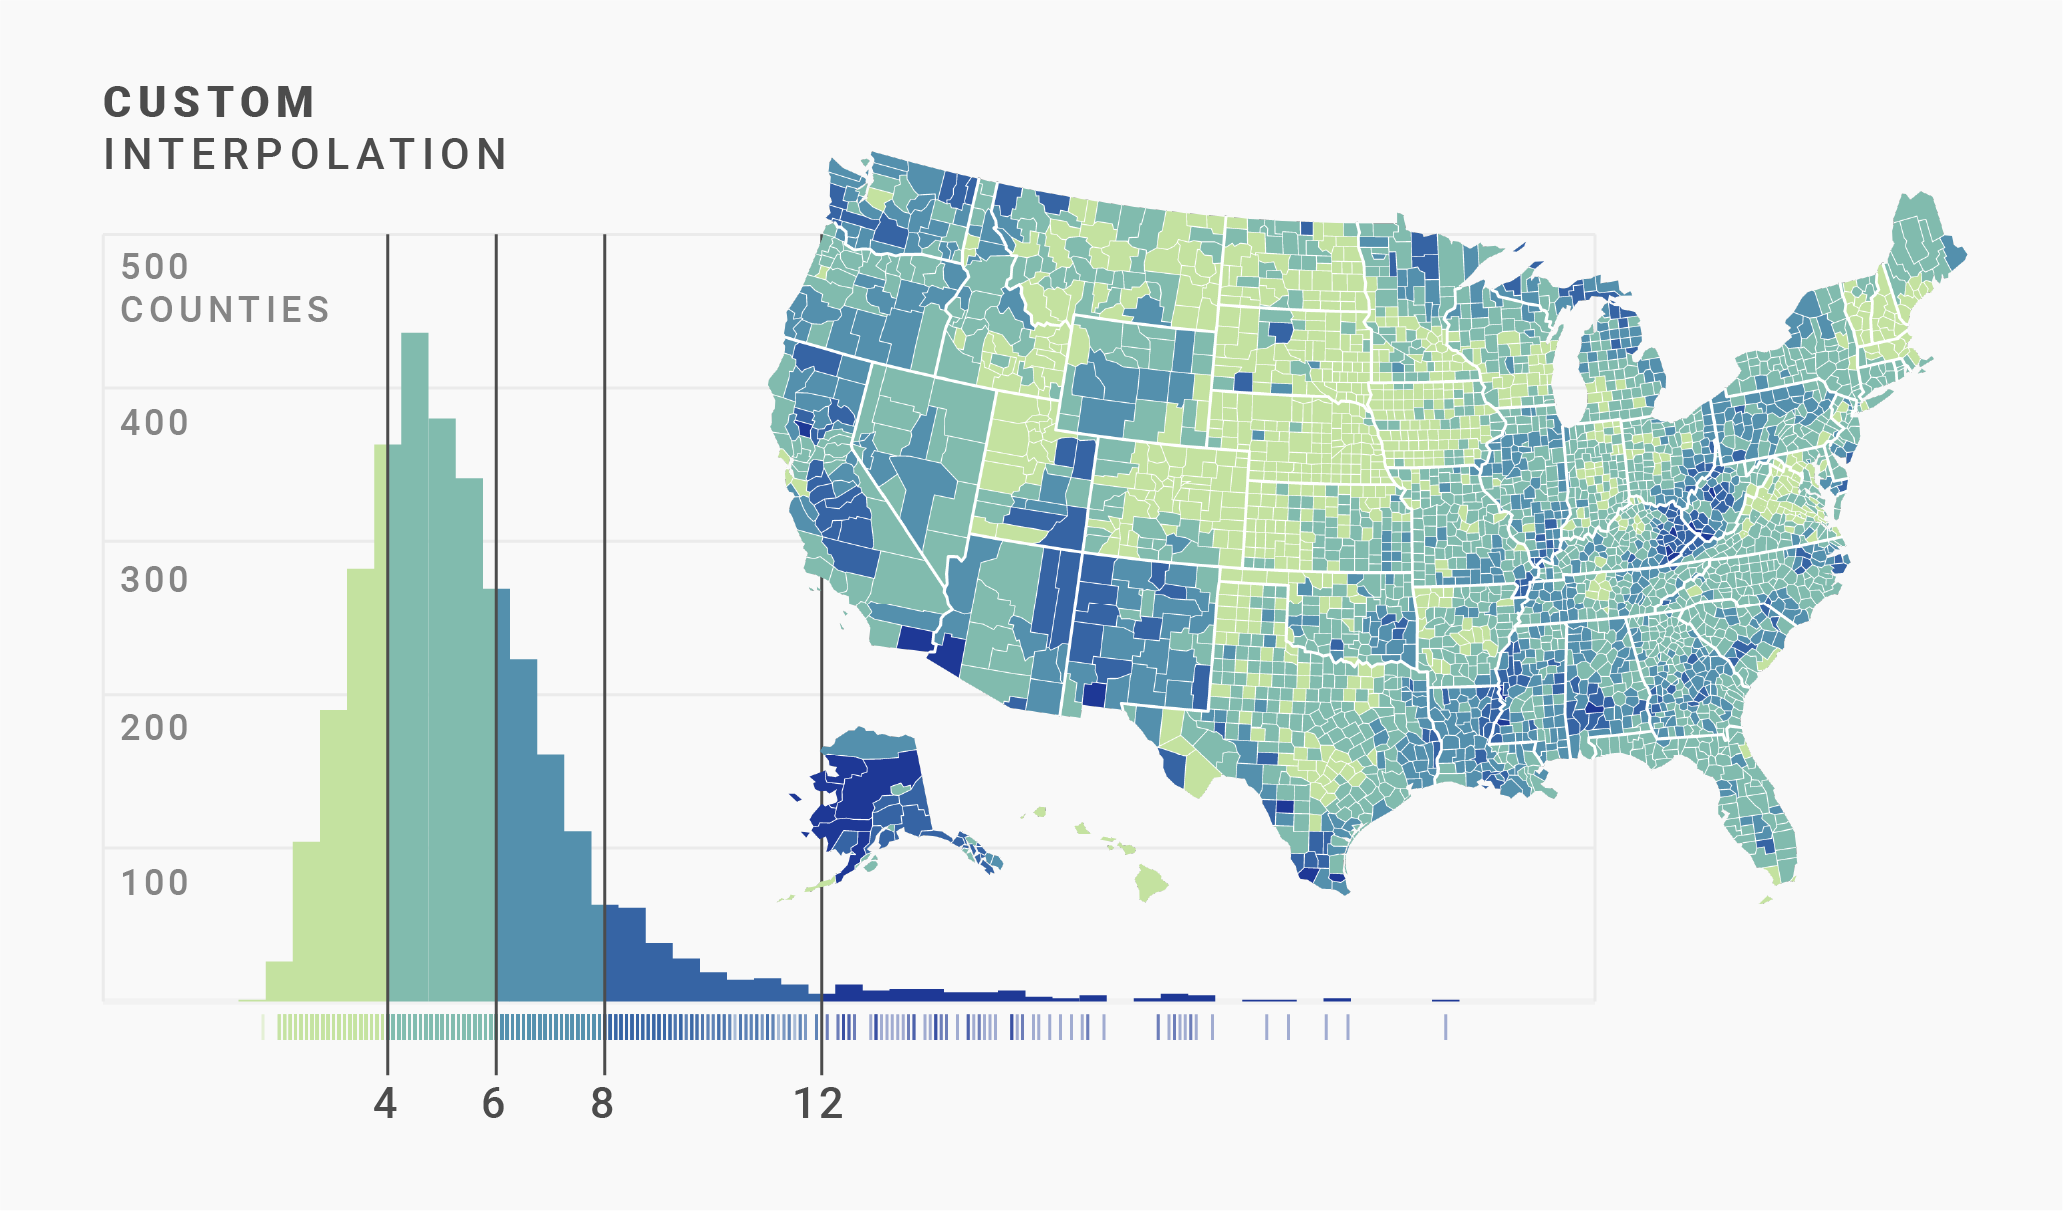
(I do think the stepped histograms look prettier).
I also worked through 90% of the explanation of interpolation for continuous scales and have only the “so which interpolation should you use?” part left. Yay! Good day.