So, yeah, it’s bad. We knew that before: Periodical print publications seem to be no fun anymore for humanity. Even the Germans, by tradition very traditional people, started to dislike them. How much? That’s what the data reveals, that OpenDataCity shared a few days ago. I like their search function, I like their bold design – but I dislike the missing possibility to compare all the magazines.
But how to compare the development of the number of copies of 560 magazines with each other? When you plot their quarterly figures in a gigant line chart, it looks like that:

Actually, surprising steady. We can’t really see the downwards trend I want to show. So I took the data and did something similar I did with the unemployment rate numbers last year: I got rid of all the quarterly numbers and just show the difference between the first and last available number. In the case of the magazine copies, we have the most numbers from 2003 and 2014, so we will compare them. First I just sorted them:
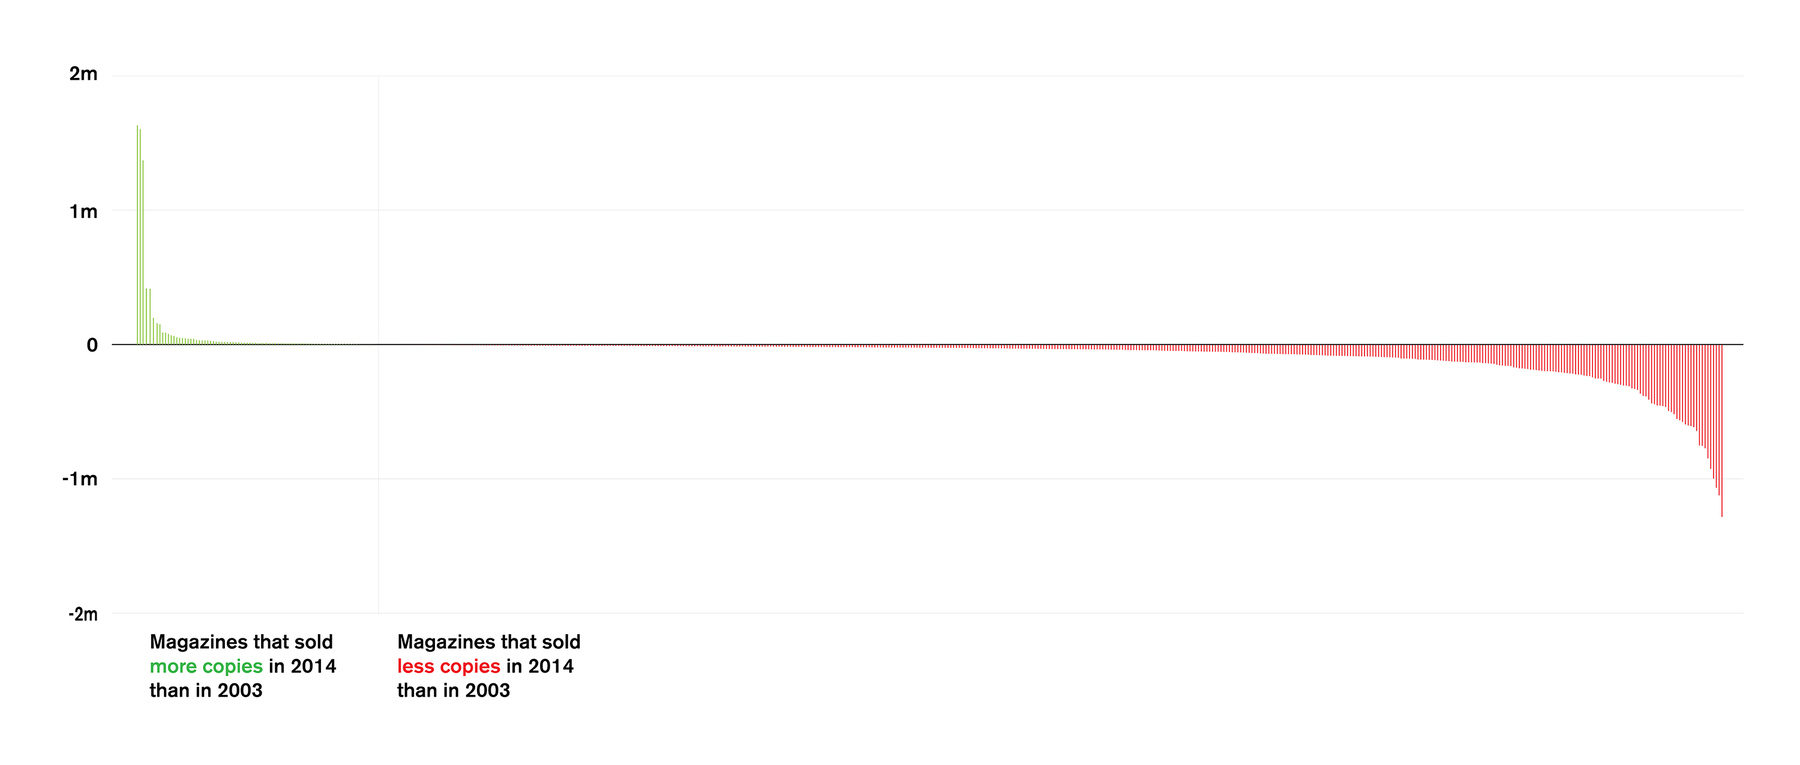
This chart tells us almost nothing, except that more magazines lost readers than gained ones. We can see a typical long tail: Few magazines lost a lot of reader, many magazines lost a few ones. But we know nothing about how many readers these magazines actually had in 2003. It may be that all magazines lost the same percentage of their readers, but that a lot of magazines have had a very small readership from the beginning. Let’s look at the percental loss than:
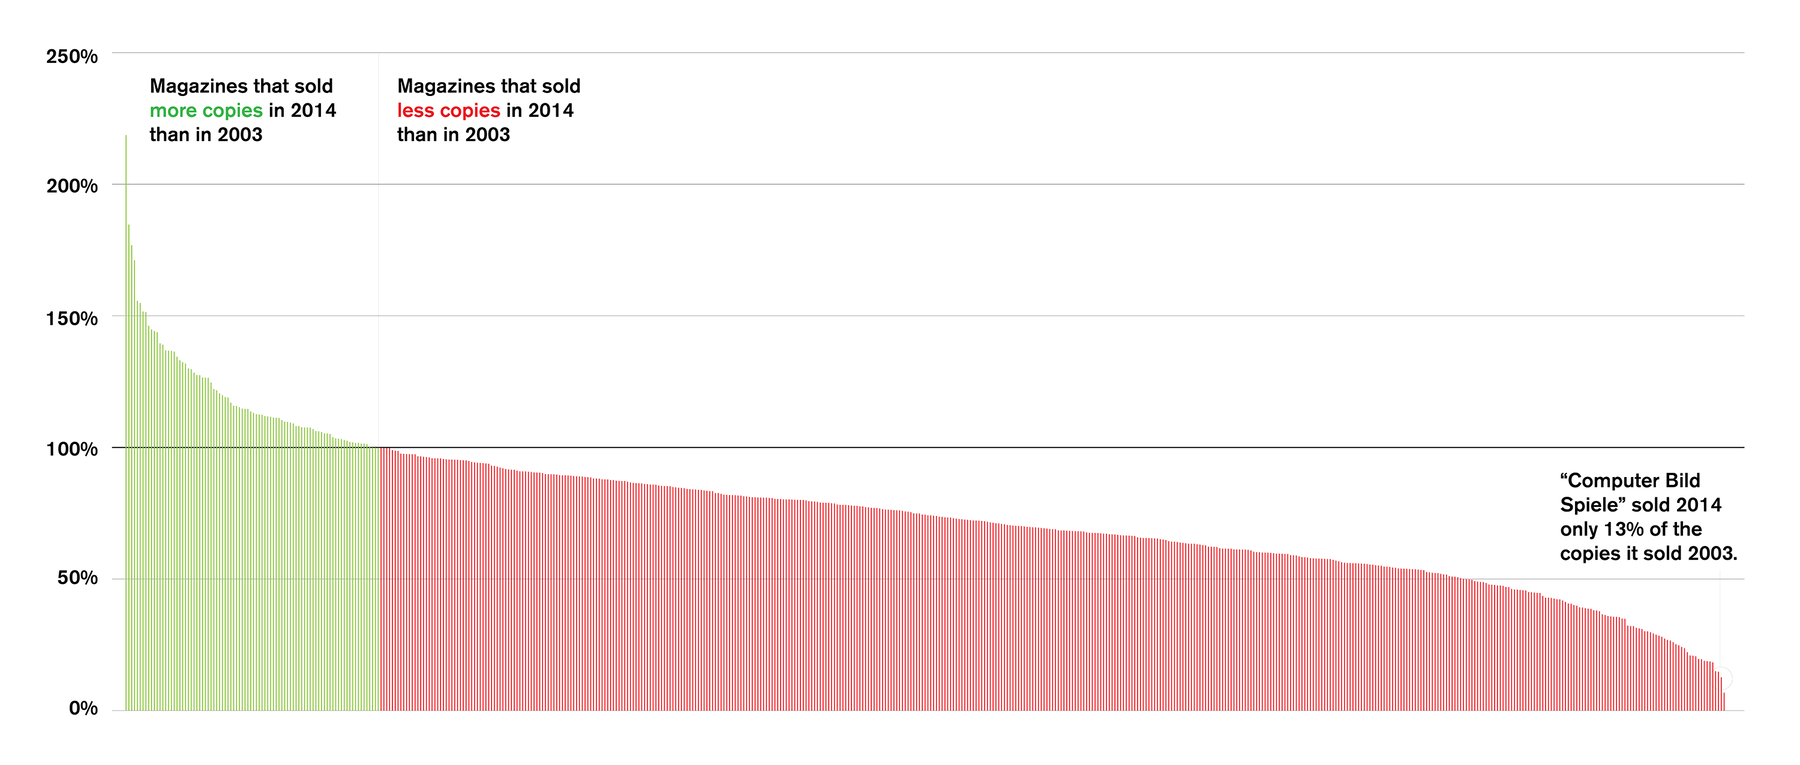
Here we can read more out of it: One magazine doubled their readership (although this could have been a magazine with only ten reader, that now has twentytwo of them). We can also see that more than 80% of the magazines still have more than 50% of their 2003-readership. Not bad. But personally, I like the following kind of chart best:
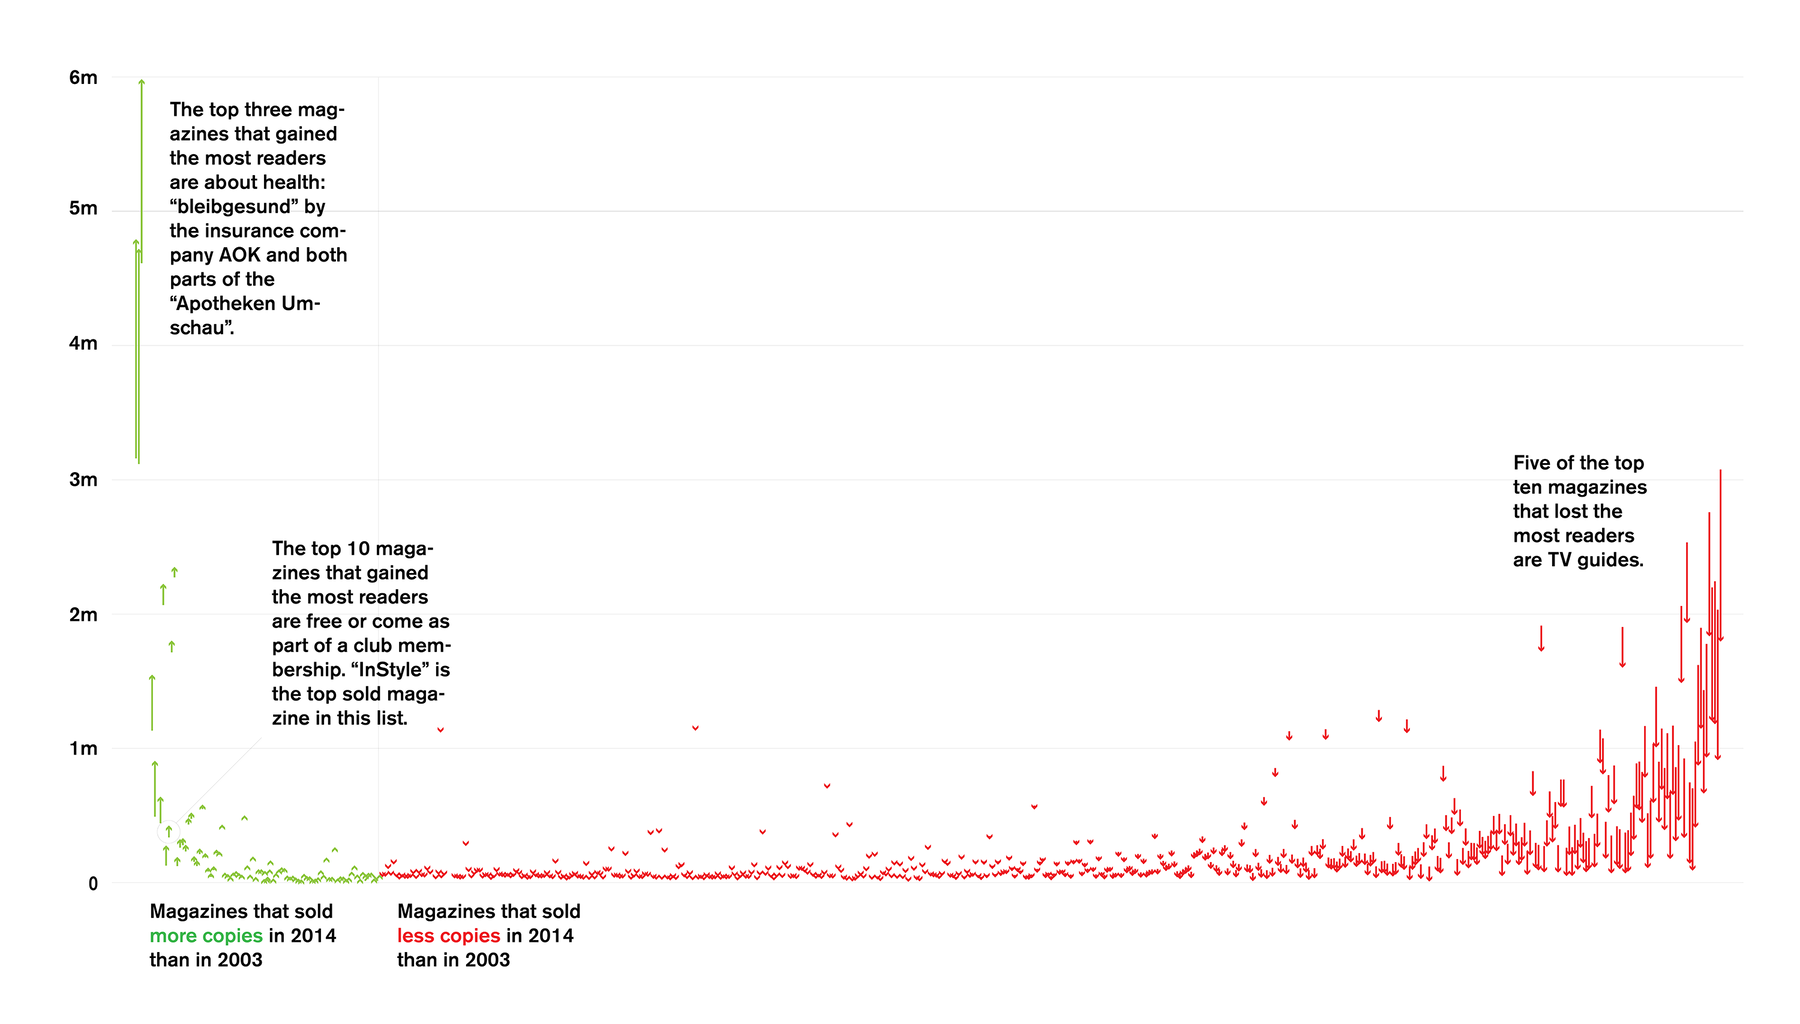
In my opinion, that chart has almost the same immediate power of a statement like the other two graphs (“So many magazines lost their readers! So sad!”), but offers more possibilities to explore. We see how many copies the magazine sold in 2003 and in 2014 in the height of the lines. The length of each line is the same from the first graph and shows the loss. The combination of both – the height of the line and the length of the line – indicates the percentage. We see interesting outliers: Three magazines seem to have sold already excellent in 2003, but even better in 2014. We see mostly magazines that have had few readers in 2003 and therefore couldn’t loose many; but in the middle of the graph are also a few magazines with a high readership in 2003 that lost surprisingly little of it.
We always have to find the best compromise between communication and information; between a bold statement we can show and the possibility for the reader to explore our data. The decision for the right balance gets made by the purpose of the graphic.