tl;dr: Self-tracking these days often results in irrelevant visualizations which give a fake comfort of meaning, but don’t help neither the tracked person nor the viewer.
![]()
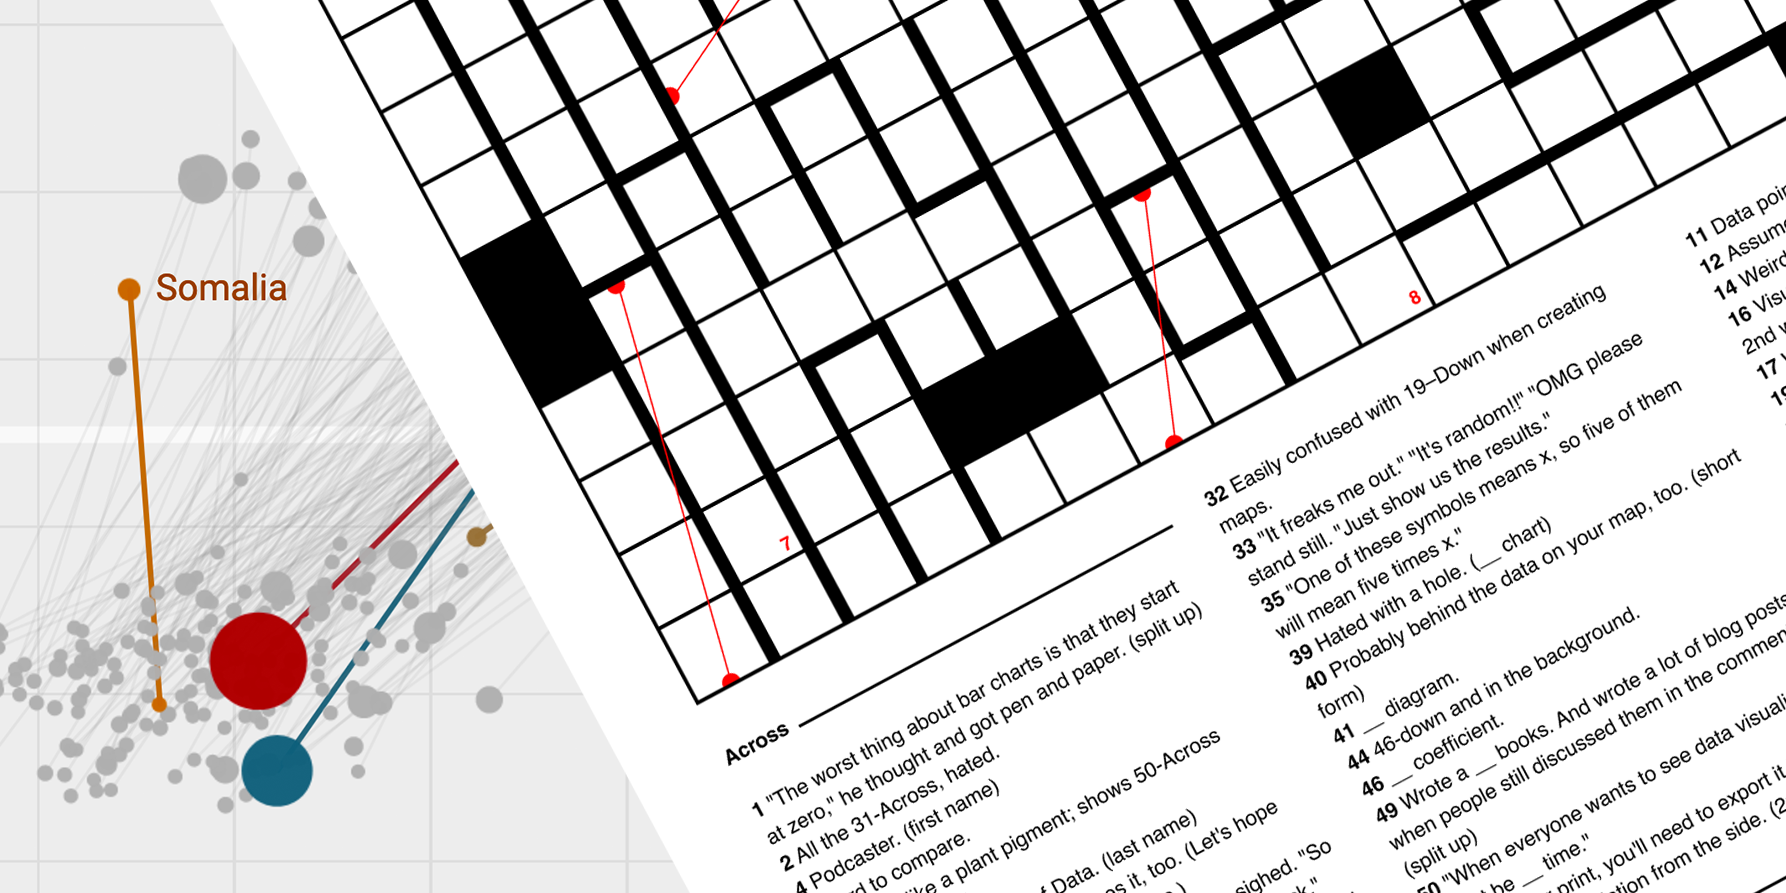
I just came back from a conversation with J. On the image you can see all the Facebook conversations I had with him since July 2014: A lot. (Mapping Facebook conversations is a side project I’ve been working on for quite some time, to learn R. I also wrote my first Python / BeautifulSoup scraper for that – I’lll publish everything + a mini tutorial on that as soon as I show y’all the final thing.)
Something J and I talked about tonight while eating not-so-awesome sushi was the whole self-tracking movement. Quantified self fans are mostly not thinking about which measurements they want to gather and analyse: They just analyse everything they can get their hands on. So they are far less people measuring / analysing / visualising “how happy I am during conversation with friends” than people measuring / analysing / visualising “music I’m listening to” – because the latter one is far easier to achieve. Just download your Last.fm data and BOOM. But fare more than analysing music preferences, reflecting conversations with friends might lead to real insights. I might want to switch my friends if I notice that they make me depressed because they’re talking about negative stuff all the time. But I won’t change my music preferences if I know that 83% of the time, I’m listening to Folk music. (My friends make me feel very happy and I’m not listening to Folk music.)
Related to that is the meaninglessness of the data points. If I would measure the influence music can have on my mood, I might discover that Folk music makes me far more depressed than my friends do. But self-tracking data points often show behaviour only. They show me the what, the when, the how long and how far. They don’t show me the reasons, the consequences, the emotions, the story, the context.
The image at the top makes that point, I hope. J and I had many, many conversations on Facebook; some of them quite emotional. But what you can see from that is….dots. You don’t see the smile on my face while I’m reading something that J wrote. You don’t see the new thoughts I got while trying to explain myself in a message. You don’t see the effect a message between J and me had on the real-life behaviour between the two of us a week later. What you see is an extreme overview of our behaviour. But what does it tell you? You would know more about the friendship between J and I if I told you two sentences than if you looked at that graph for two minutes.
What this image gives you, however, is a FAKE sense of understanding. You think you know the relationship between J and me, now that you have an overview of the what’s and when’s. But you don’t. It’s comforting to think you know something in a complex world. That’s one reason why we all love data vis so much. But let us be honest, and let us repeat constantly: Just because we see a scientific or pretty looking image doesn’t mean it’s relevant, true or complete. I enjoy the excitement in the current society for pretty-looking data vis, but I do wonder: When will we start questioning the relevance of data vis like this one?
Just to be clear: I’m not arguing against collecting or analysing data on behaviour. I advocate for adding data that leads to real insights. Data about behaviour just touches the surface – but it doesn’t show us anything about the why’s. I tried to explain that in the first part of my blog post “Personality traits for a data vis career” and at the end of my blog post about my kind-of-also-meaningless-self-tracking-project “Searching through the Years”.
Two projects need to be mentioned, of course, and they serve as perfect examples for my point. Just ask yourself the question: How well do you know Nicholas Felton, and how well do you know Giorgia Lupi and Stefanie Posavec? Do you get a bigger sense of empathy out of the fact that Felton used 54,693 exclamation marks in 2013, or that Giorgia Lupi had 41 negative thoughts in one week in 2015; mostly generic sadness? Just saying. And yes, I’d love to compare data on how much their projects changed Felton’s and Lupi’s/Posavec’s lives, respectively.
What I’m trying to say here? Let’s do self-tracking right. Let’s track for insights and meaning, not because we can and it looks pretty.