Let’s map the unmapped voters. Let’s not show the winner of each state, but the percentage of people and voters that voted for a specific candidate: The popular vote. I talked and wrote about the reasons to do so. The following graphics and maps are dedicated to the popular vote of the US Election 2016 (you know, the one last week. The one where Trump won).
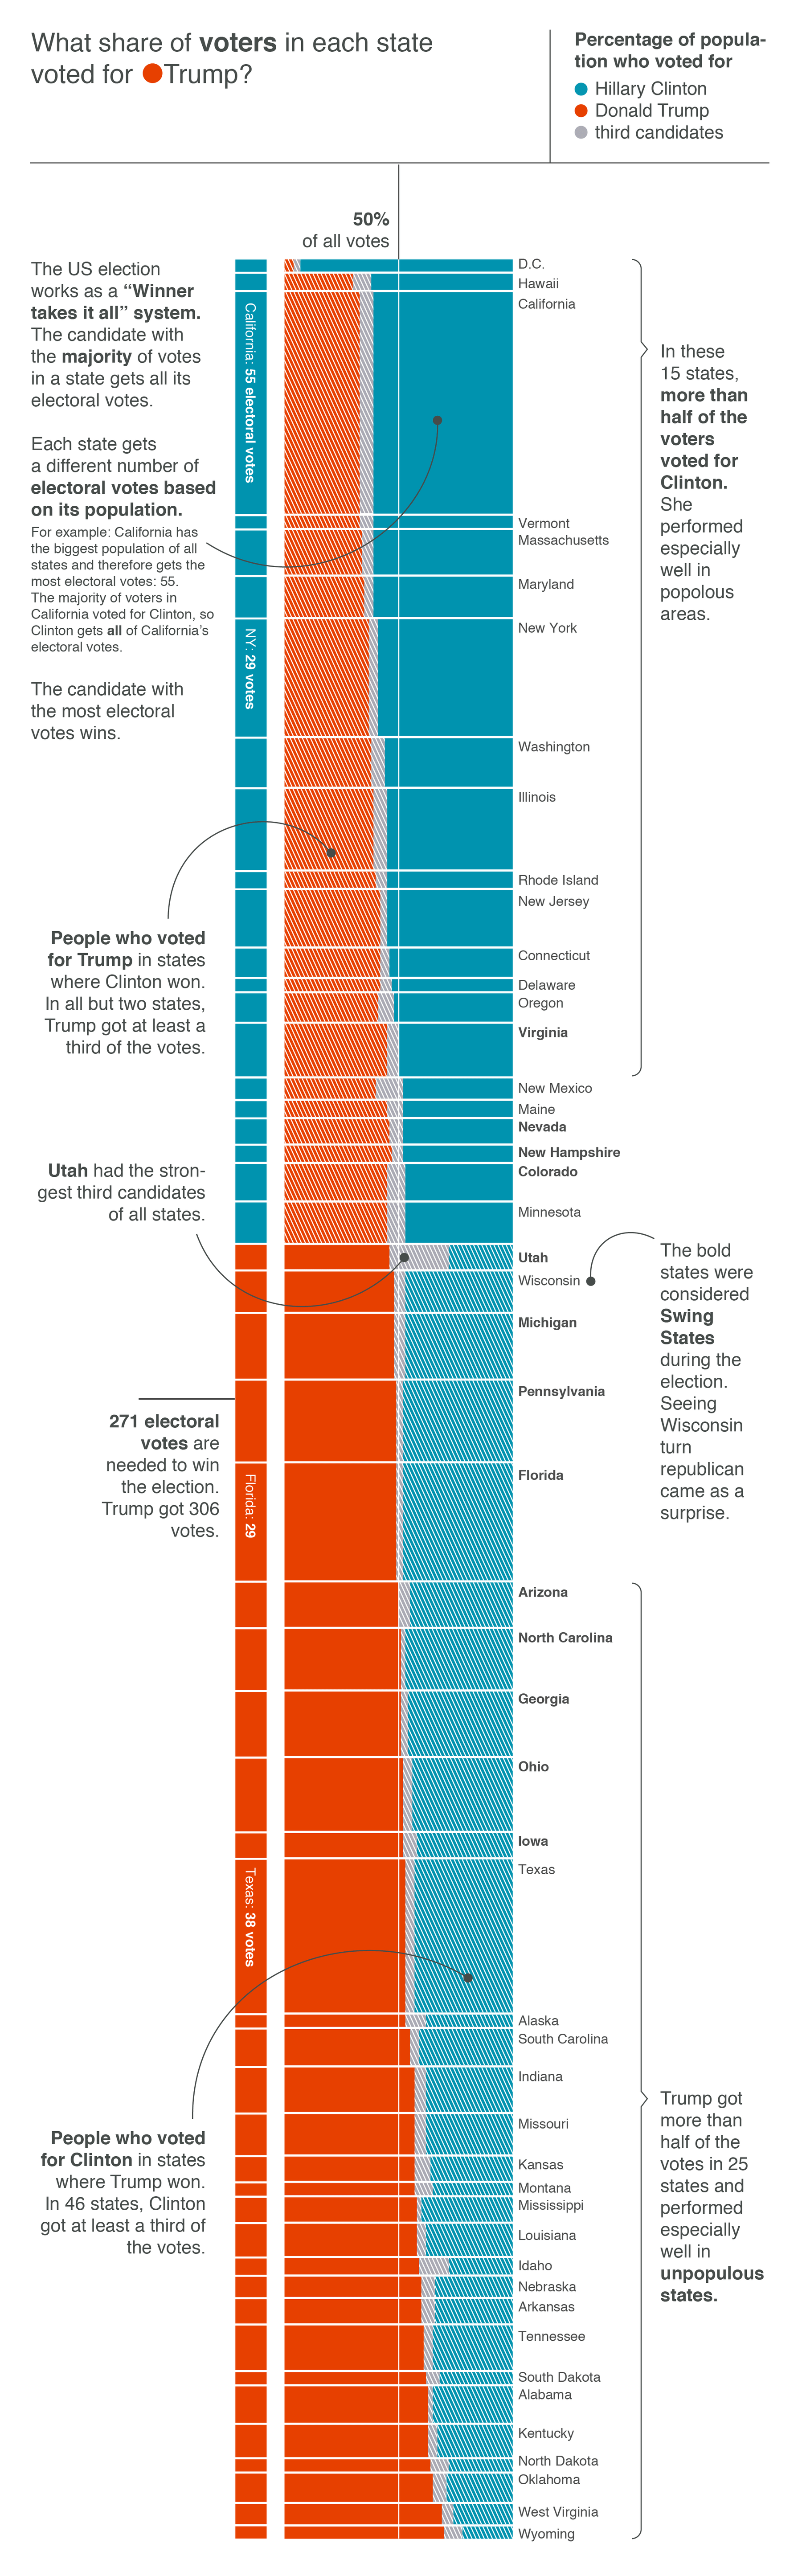
Let’s start with an explanation of the electoral college:
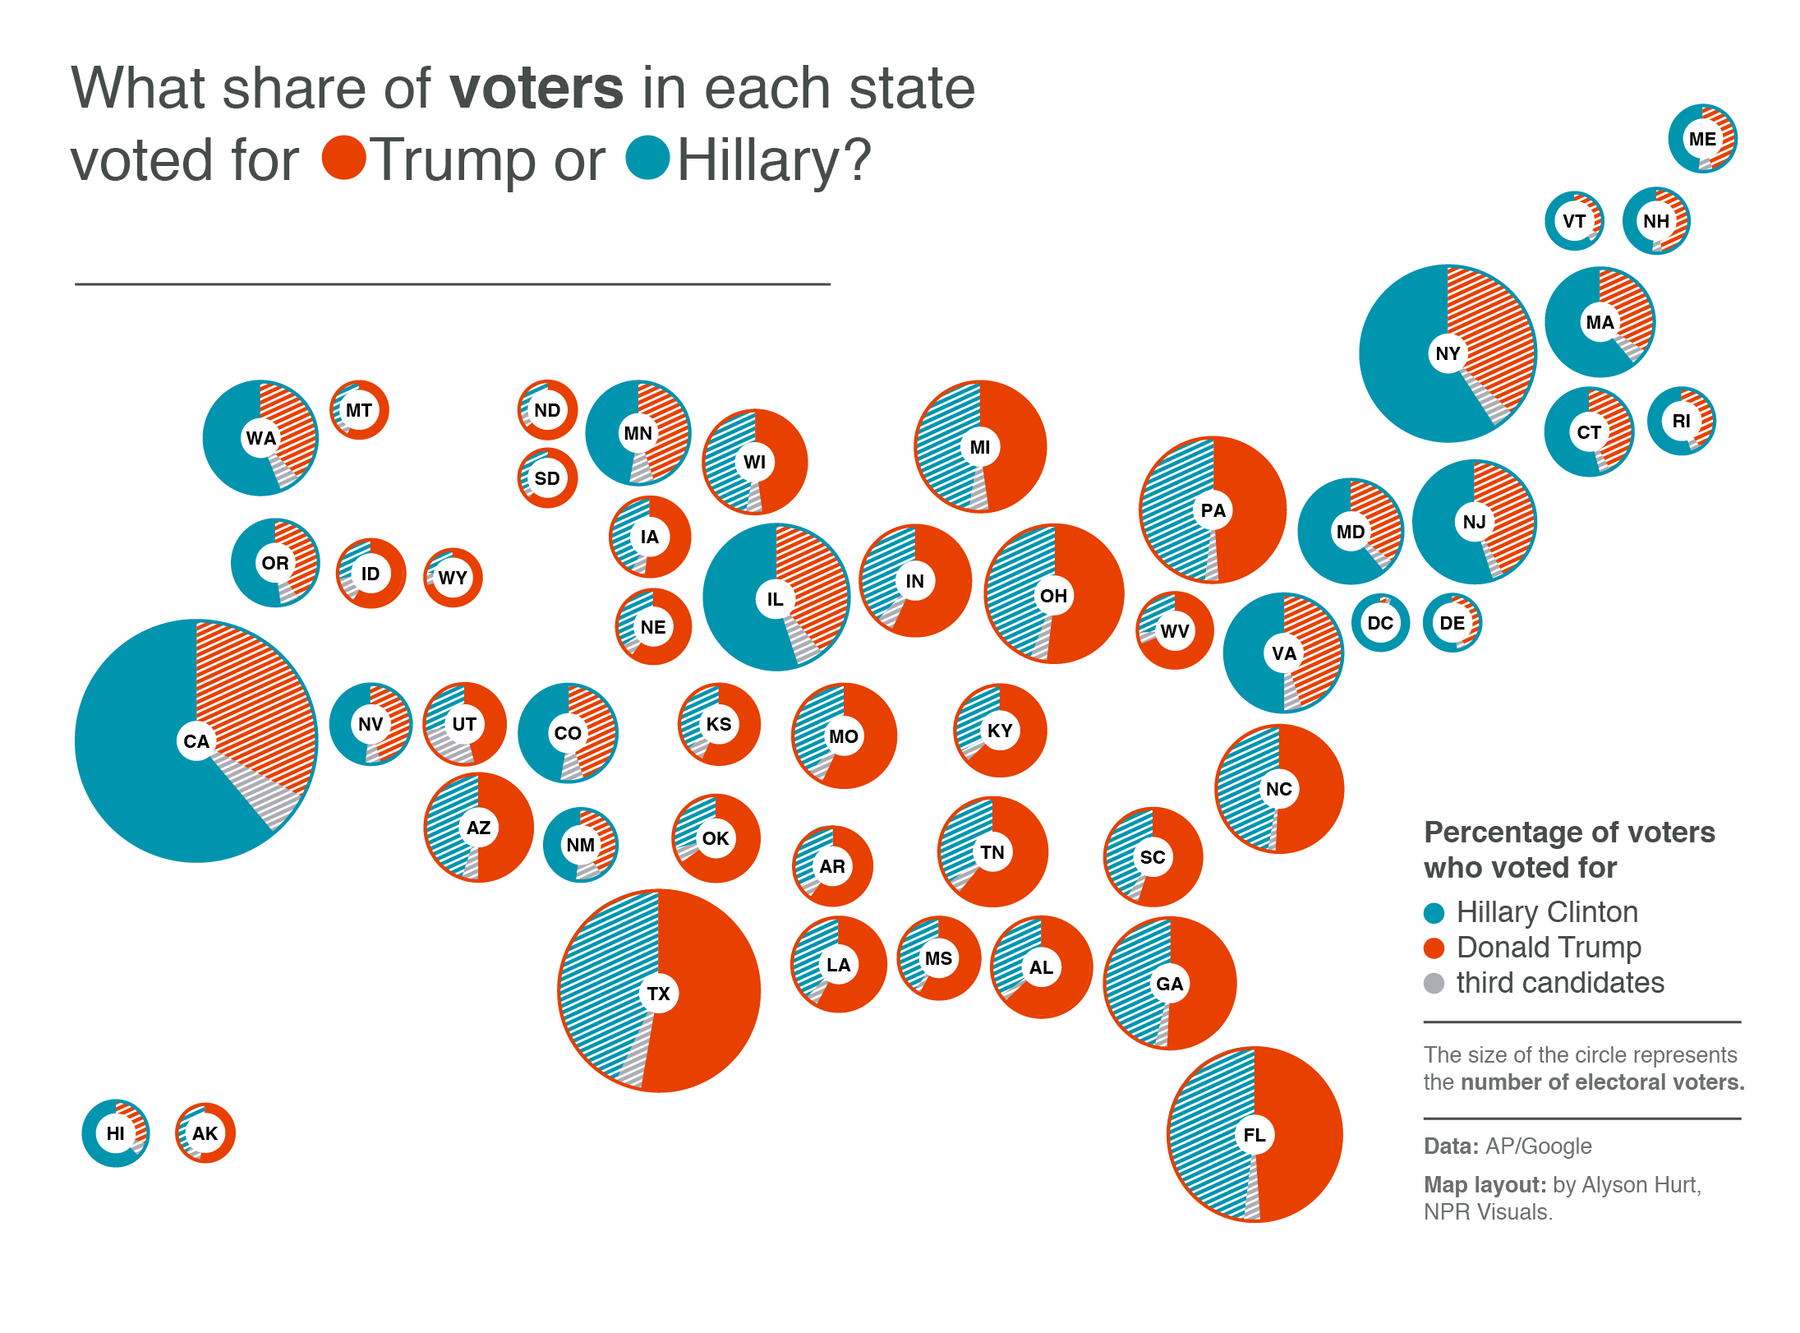
If we know the percentage of people who voted for the winning candidate in each state, we can look at the votes that we normally don’t find on a map:
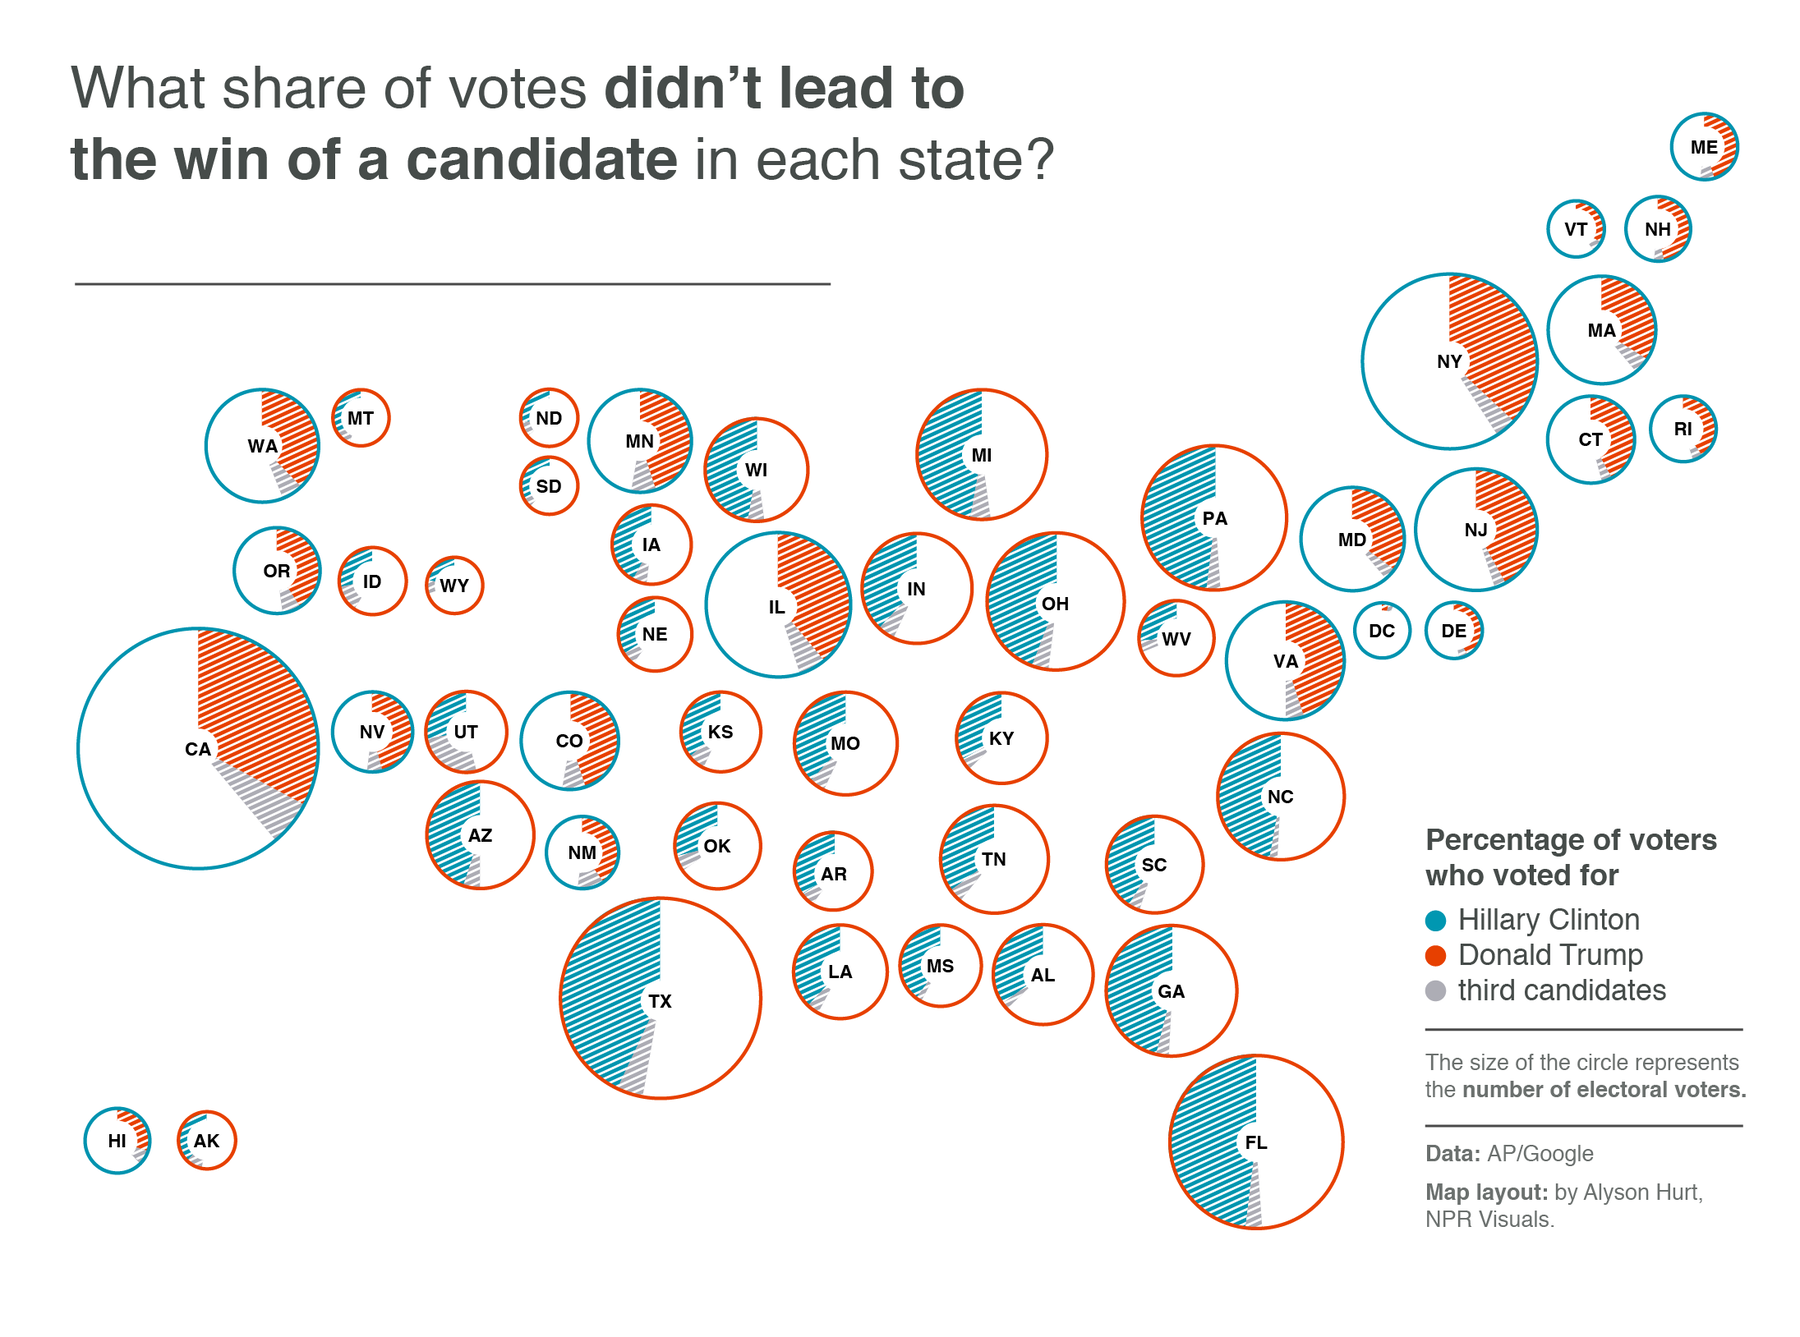
This map prove once again that it was a close race. There were lots of blue votes in red states – and lots of red votes in blue states.
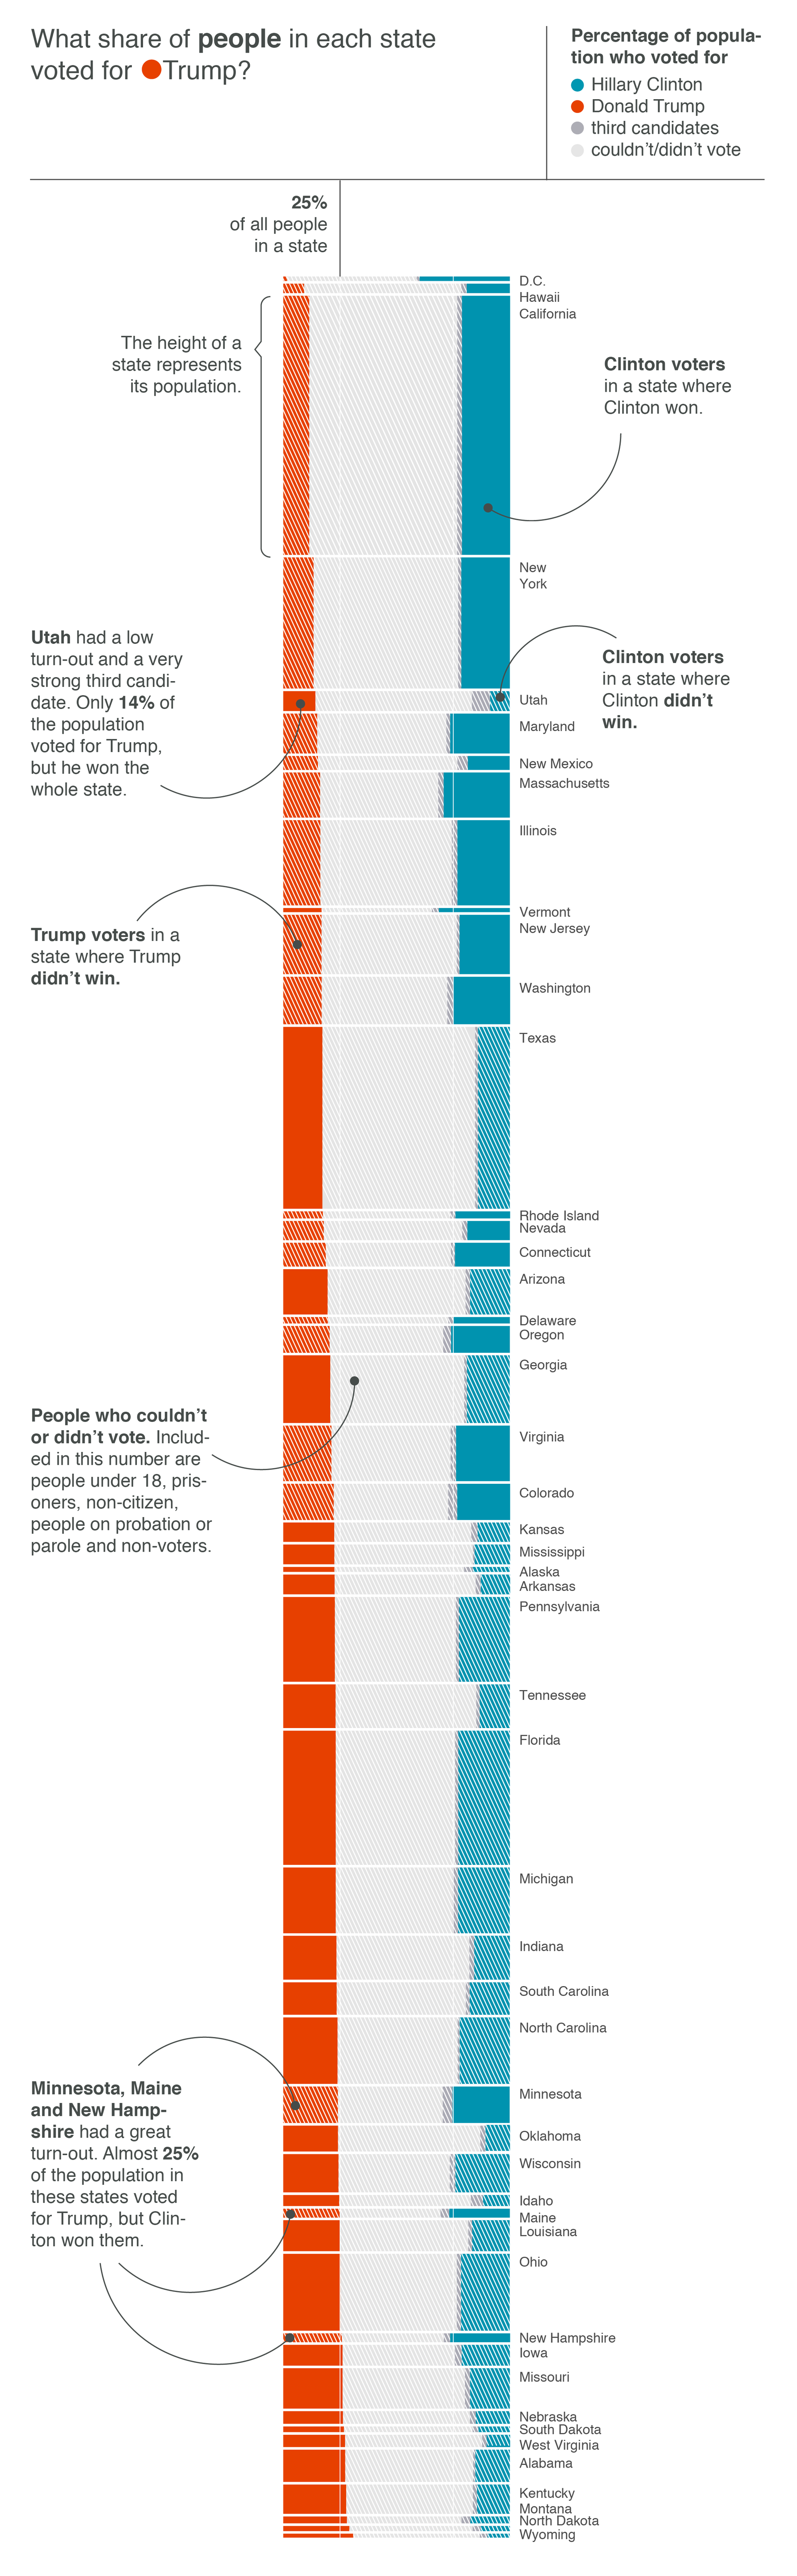
If we go one step further, we can take non-voters into account: People who are not allowed to vote (because they are under 18 years old, in prison etc.) and people who didn’t want to vote. And this time, we don’t look at the electoral college votes, but at the population. The states in the following graphic are sorted by the share of the population that voted for Trump. We can see that a greater share of people voted for Trump in red states like Texas or Utah than in blue states like Delaware or Oregon:
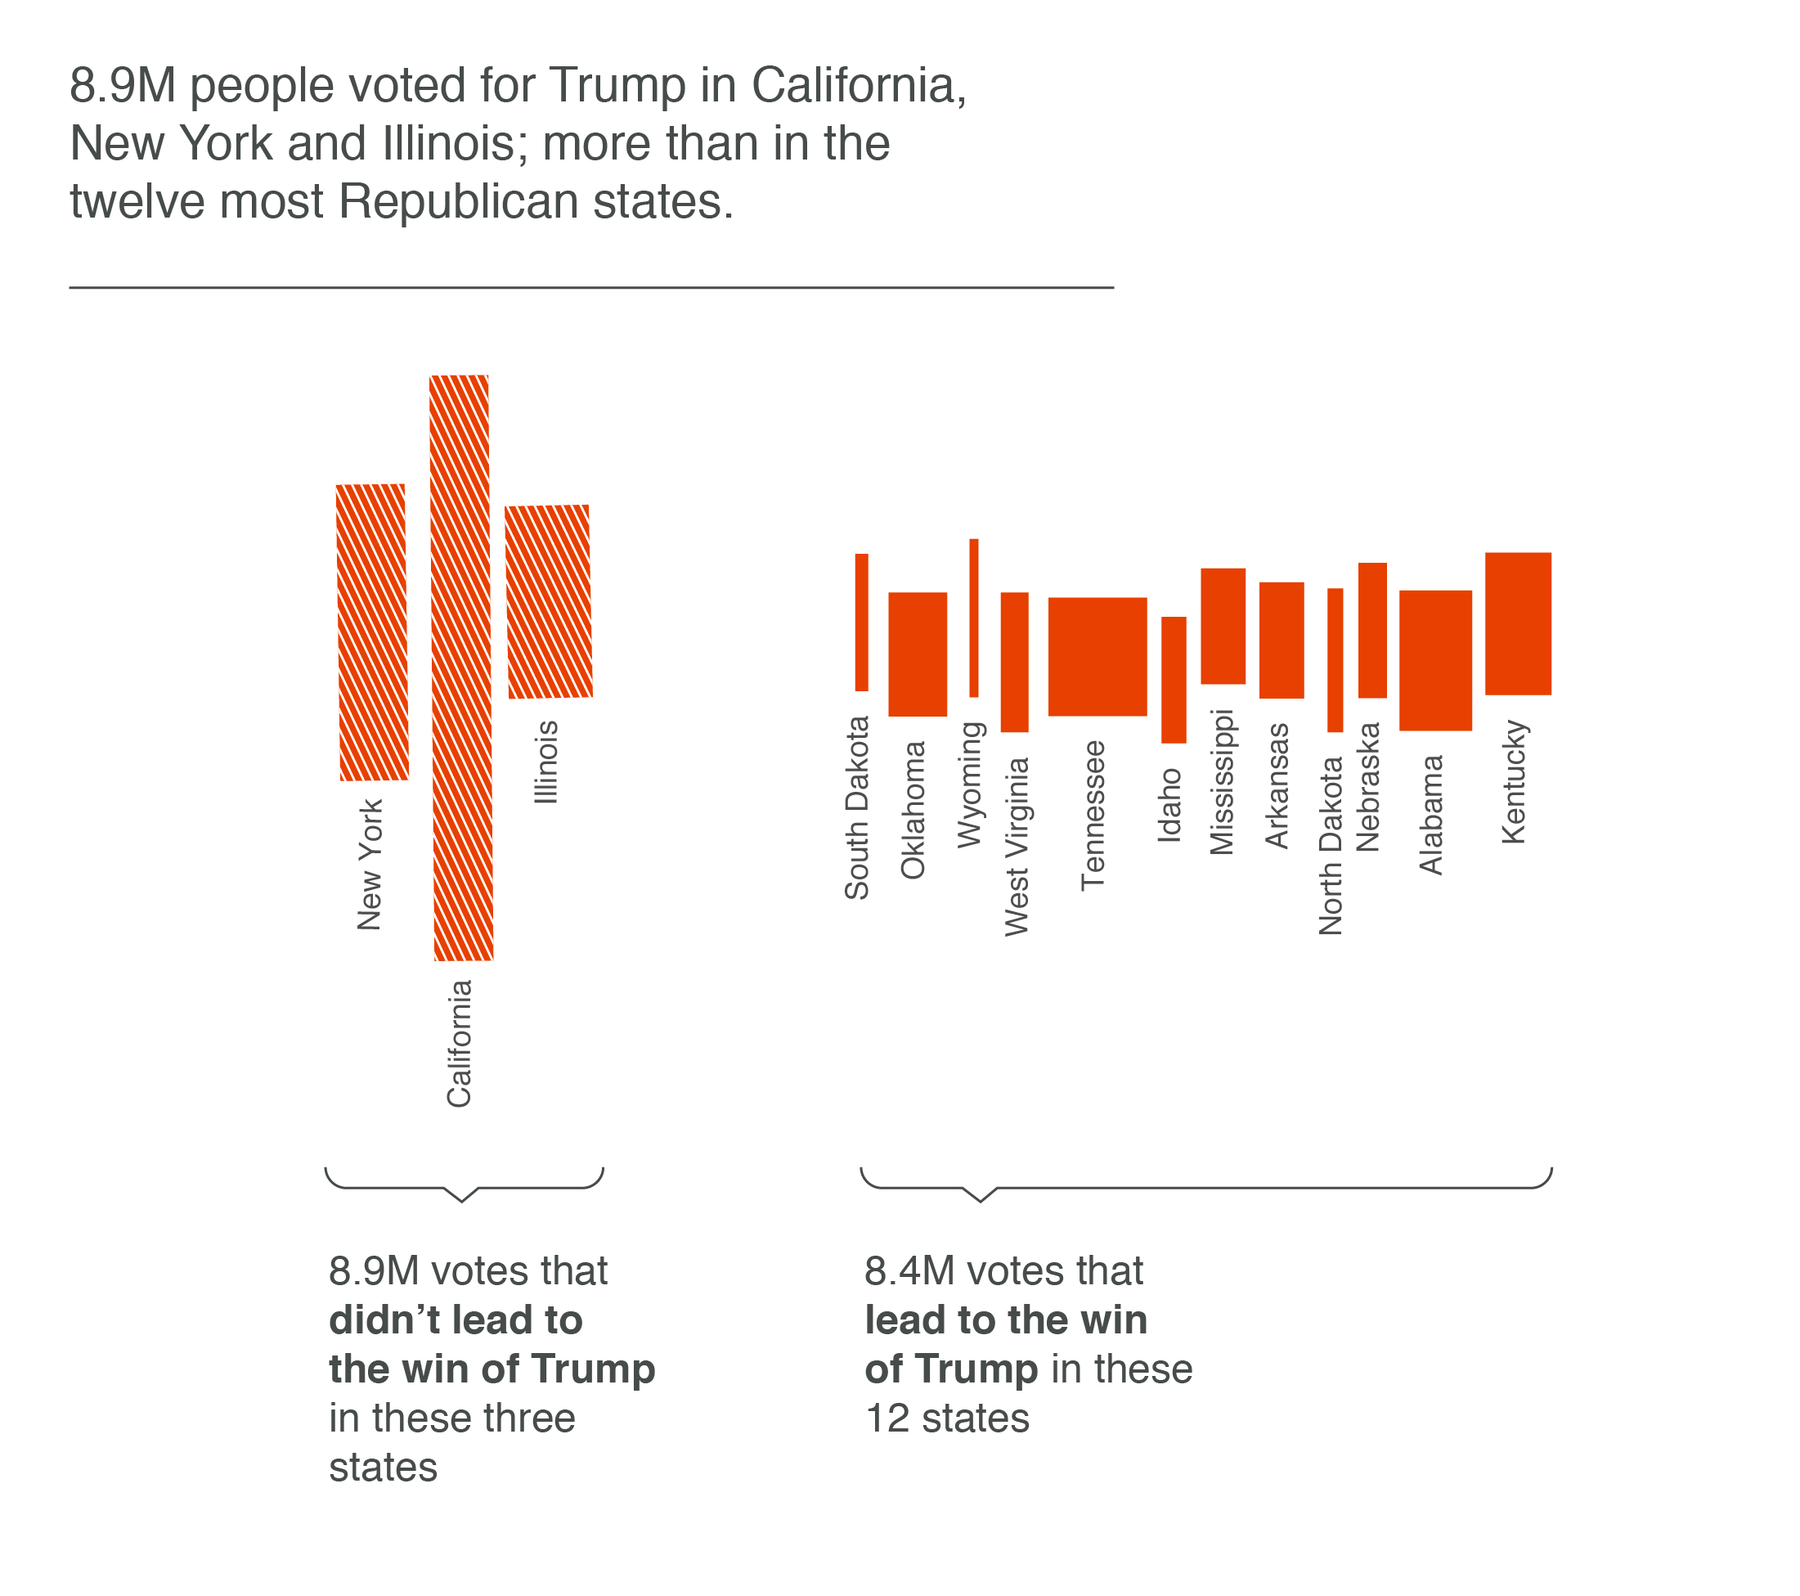
In fact, thanks to the immense population in blue states, there were more Trump voters in Illinois, New York and California than in 12 of the most red states:
Do you have comments, better ways to map the popular vote or found mistakes? Let me know on Twitter or write to lisacharlotterost@gmail.com. Thank you!