2020 was full of corona charts. On March 6, I published the article “17 (or so) responsible live visualizations about the coronavirus, for you to use” and spent a lot of time maintaining it. It still updates now, in September 2021, while I’m writing these words.
Besides charts showing Covid-19 cases, 2020 was the year of tooltips for me. I created different kinds of charts in Datawrapper map tooltips with HTML and CSS:
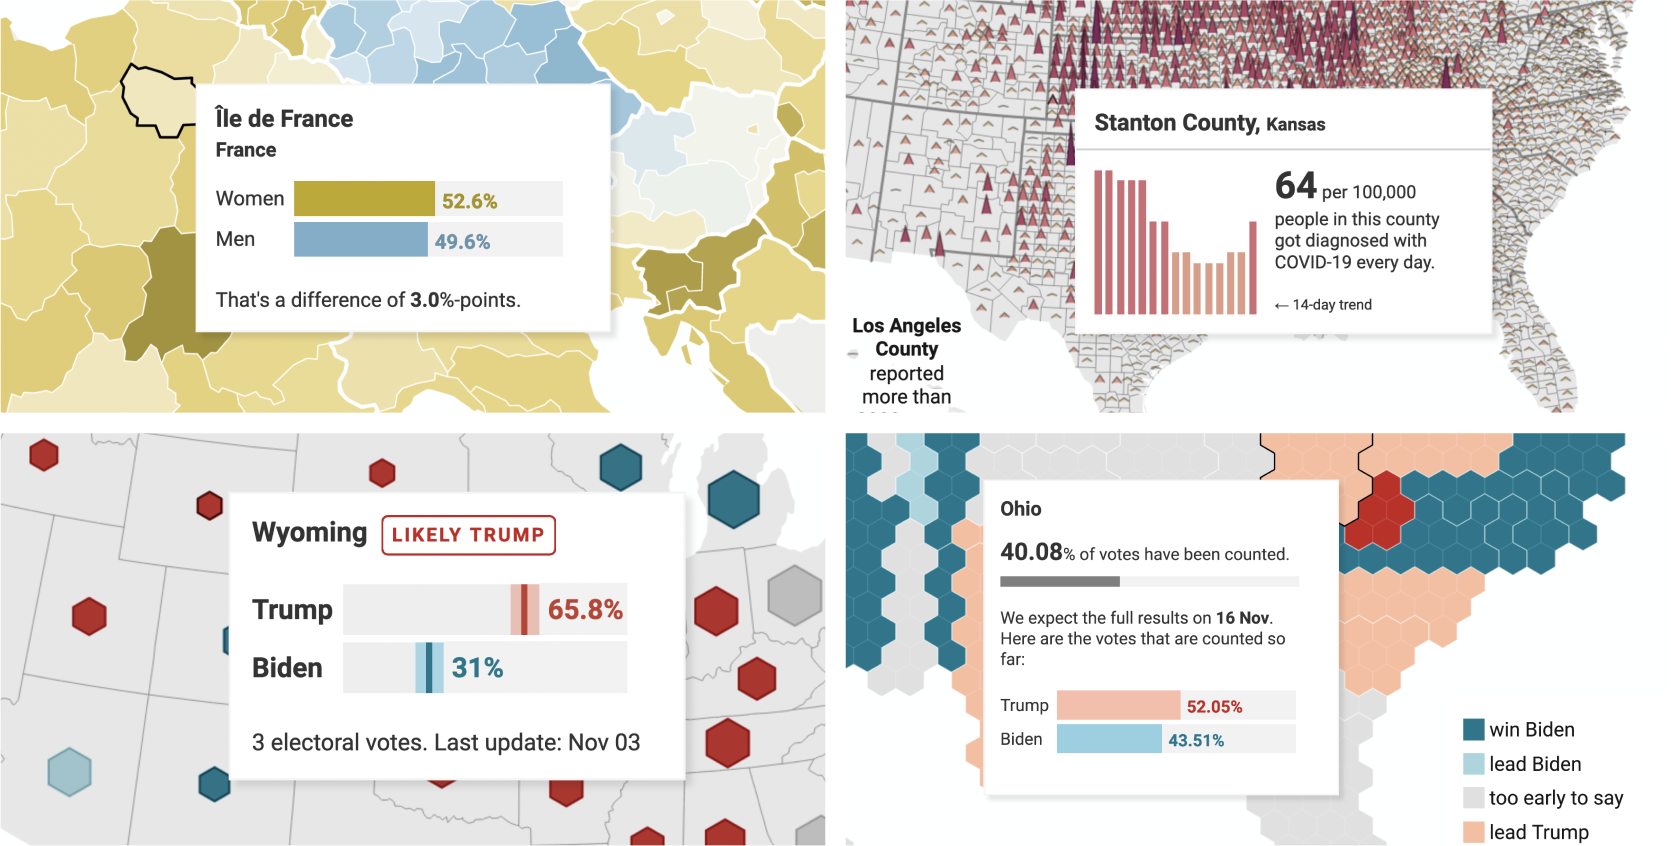
You can see these tooltips in action in some of the maps below. Try to hover over them.
So here are some of the best Datawrapper charts from 2020. I apologize in advance for the long loading time…these embedded iframes need some time to express themselves.
→ Datawrapper website
→ Datawrapper Blog (incl. Weekly Charts)
From our feature announcement “Create better, more responsive text annotations (yes, also on maps)”. Read it here.
From my blog post “How to visualize polls & results of the U.S. elections with Datawrapper”. Read it here.
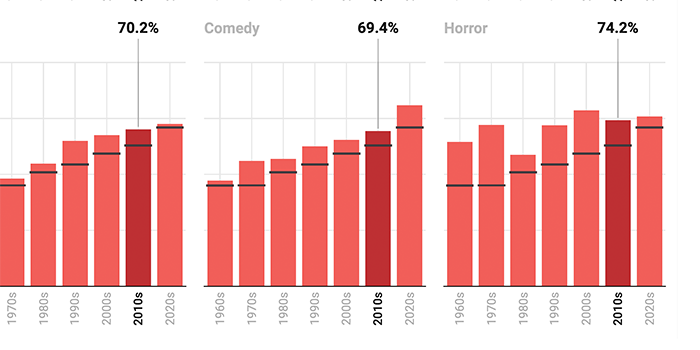
From my Weekly Chart “Women graduate, men are in power”. Read it here.
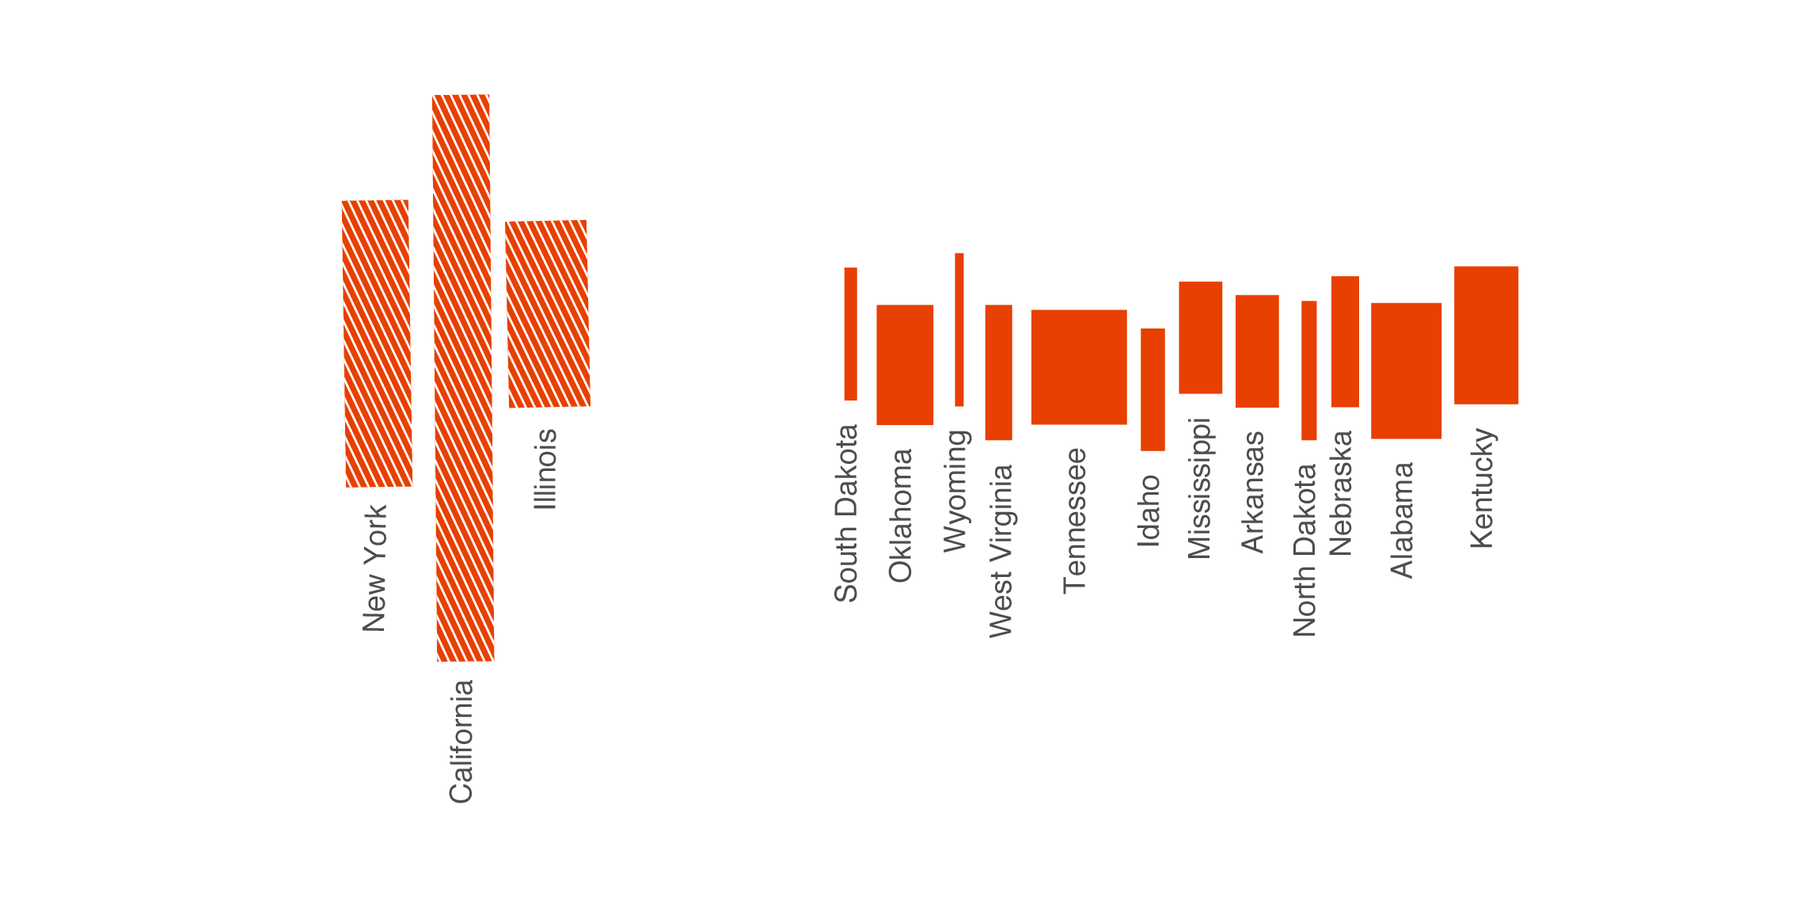
From my Weekly Chart “How I brought column charts into map tooltips”. Read it here.
From our feature announcement “New in locator maps: Add regions as area markers”. Read it here.
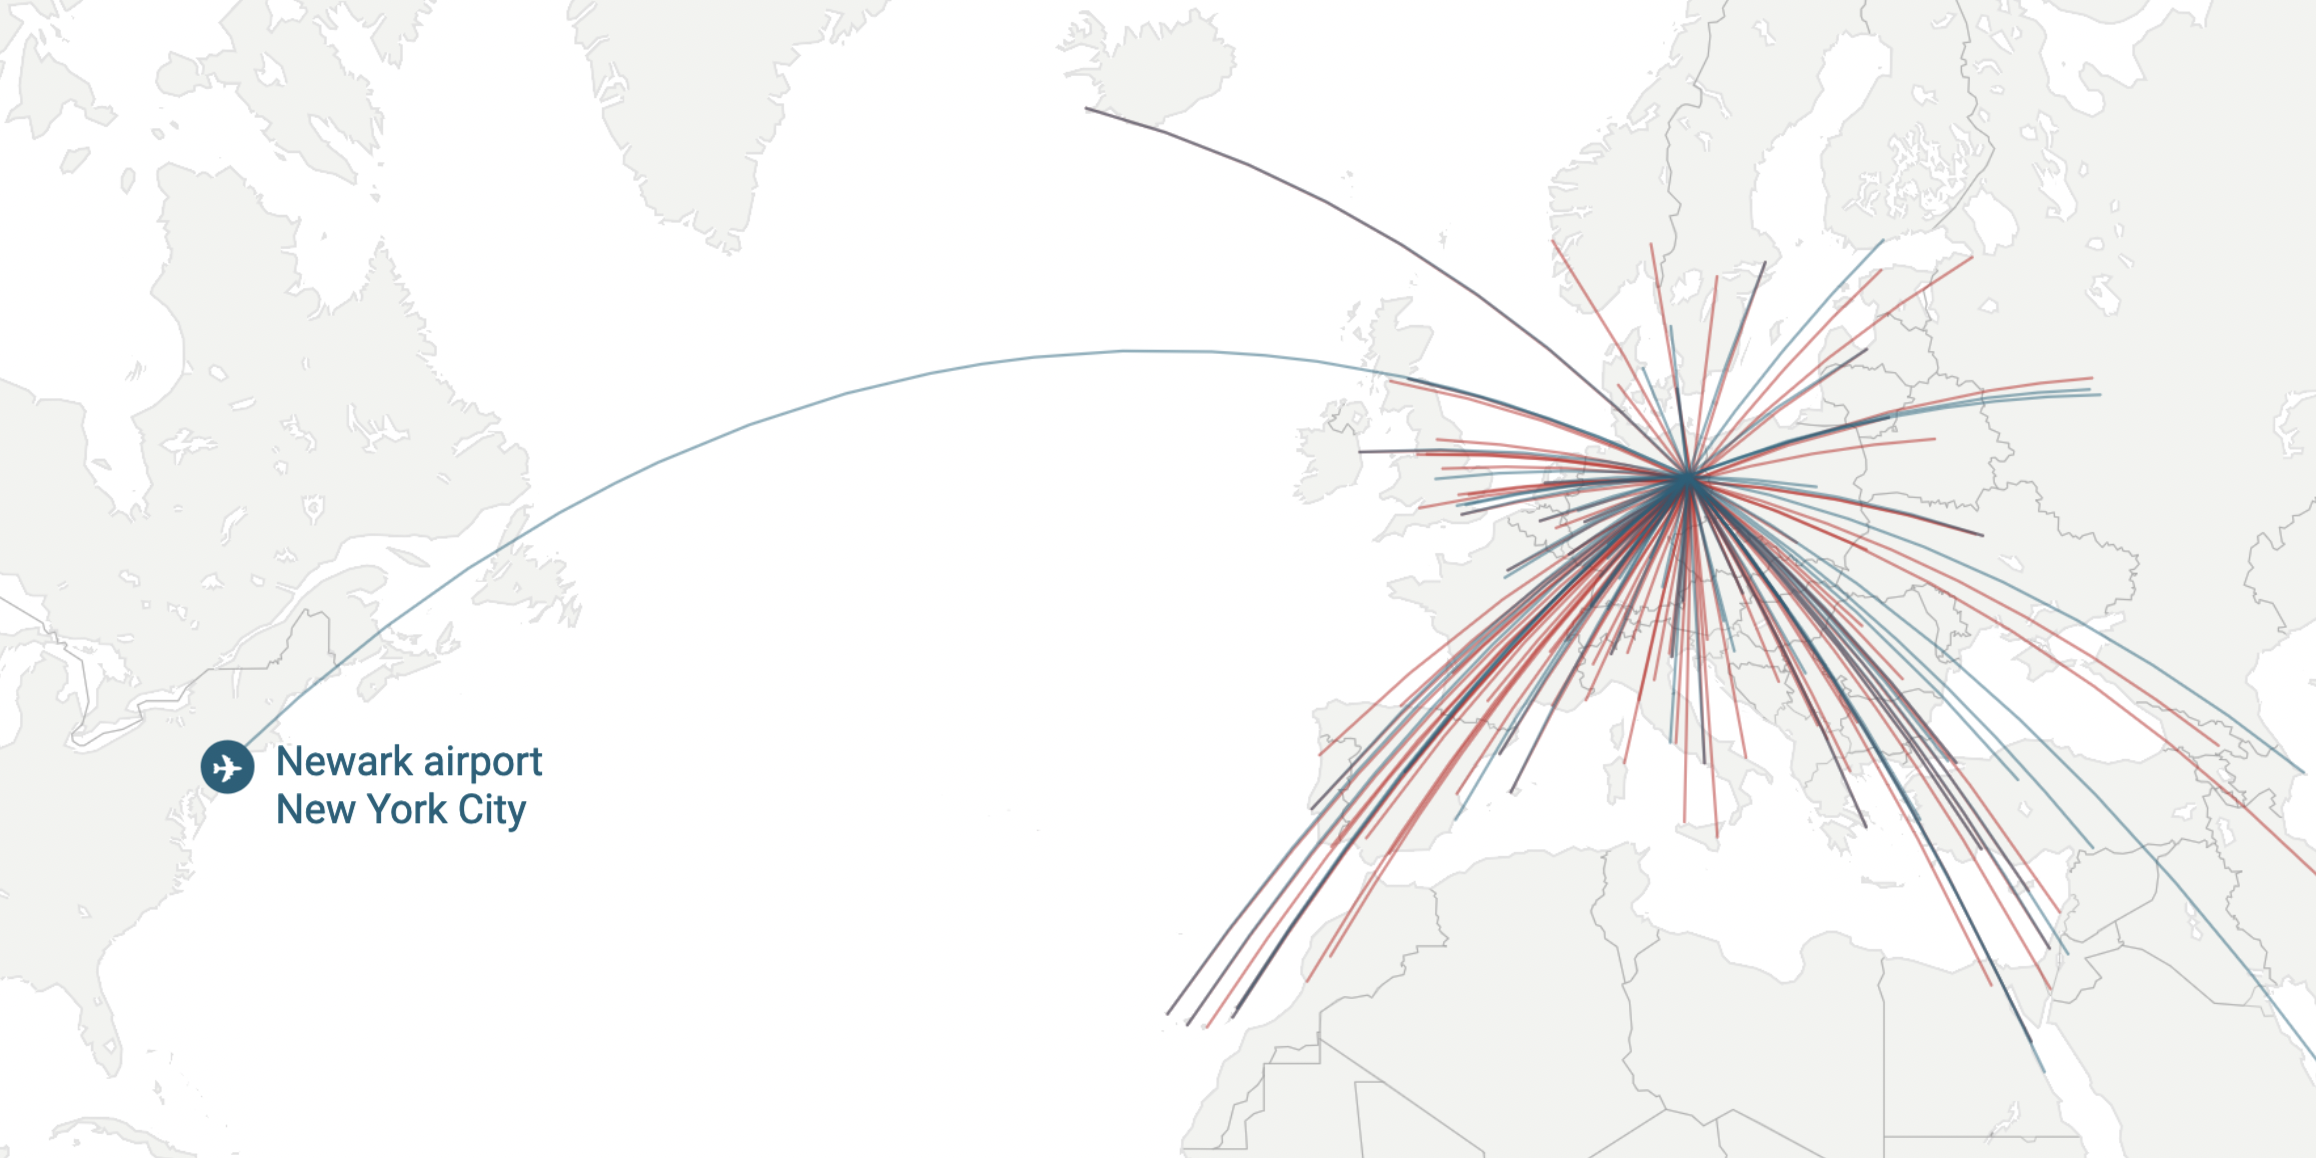
From my Weekly Chart “Why the UK has the better system for public holidays”. Read it here.
From my Weekly Chart “#FlattenTheCurve, but by how much?”. Read it here.