In 2024, we released a lot of new features into the world and hence published an unusual high number of feature announcements. For some of them, I created charts showing off the new options.
And yes, I got to write a few Weekly Charts, too. Most noticably:
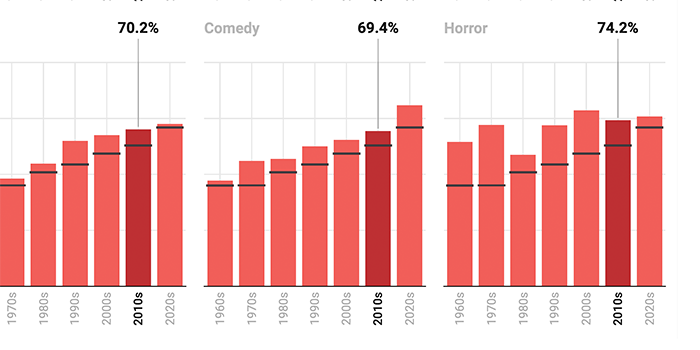
- We’re waiting longer than ever for our favorite TV shows to return
- A bad chart got better – and then bad again
Here’s more:
For my Weekly Chart “Where would Germany be without Fukushima?”, published on April 4th, 2024 Read it here.
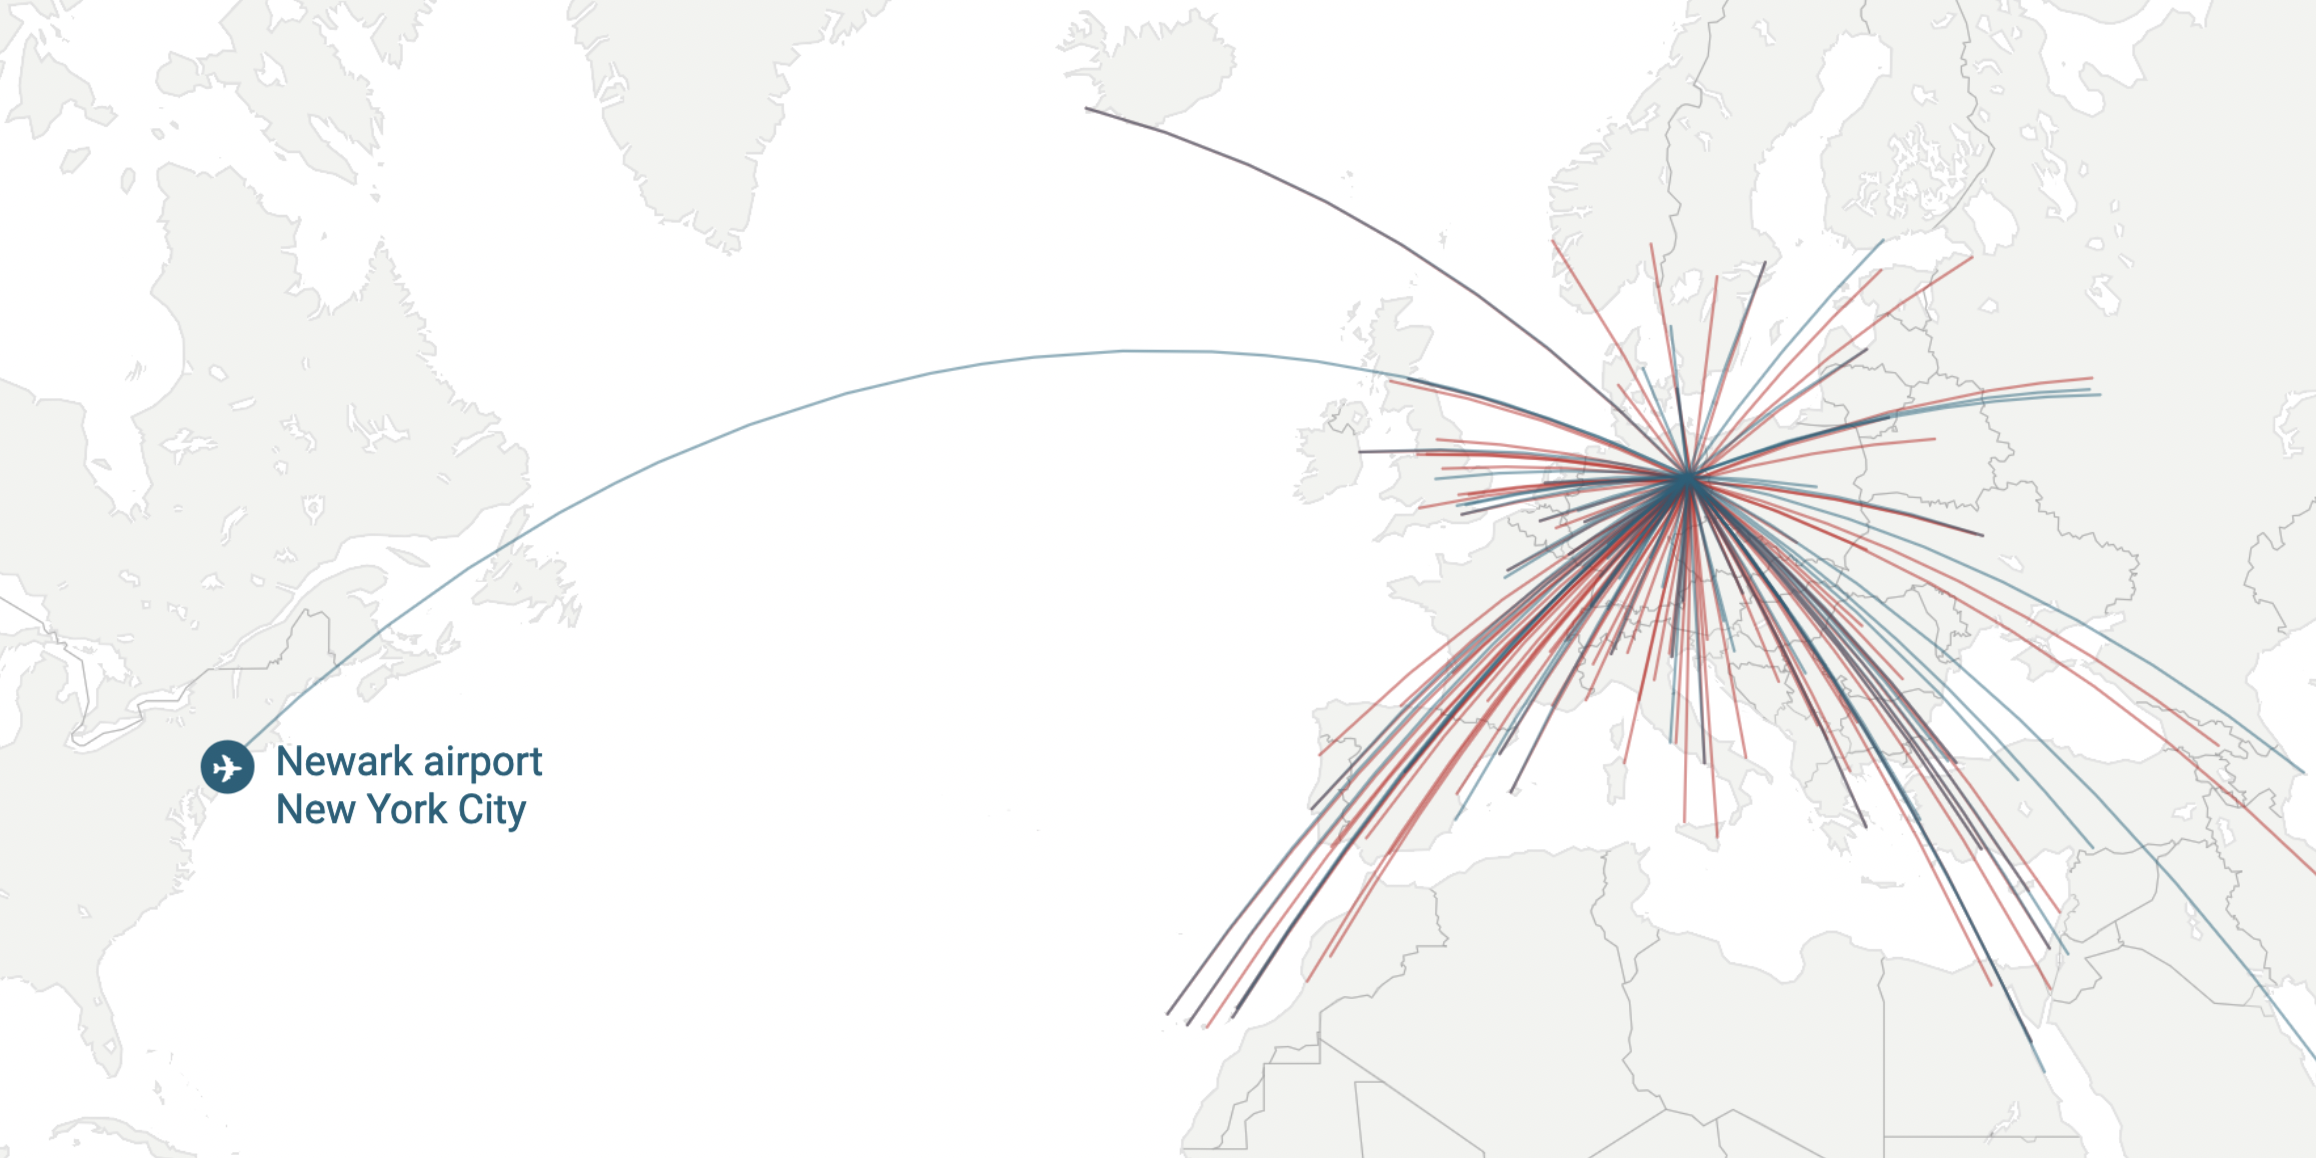
For our feature announcement “New: Annotations in bar, range, and dot charts”. Read it here.
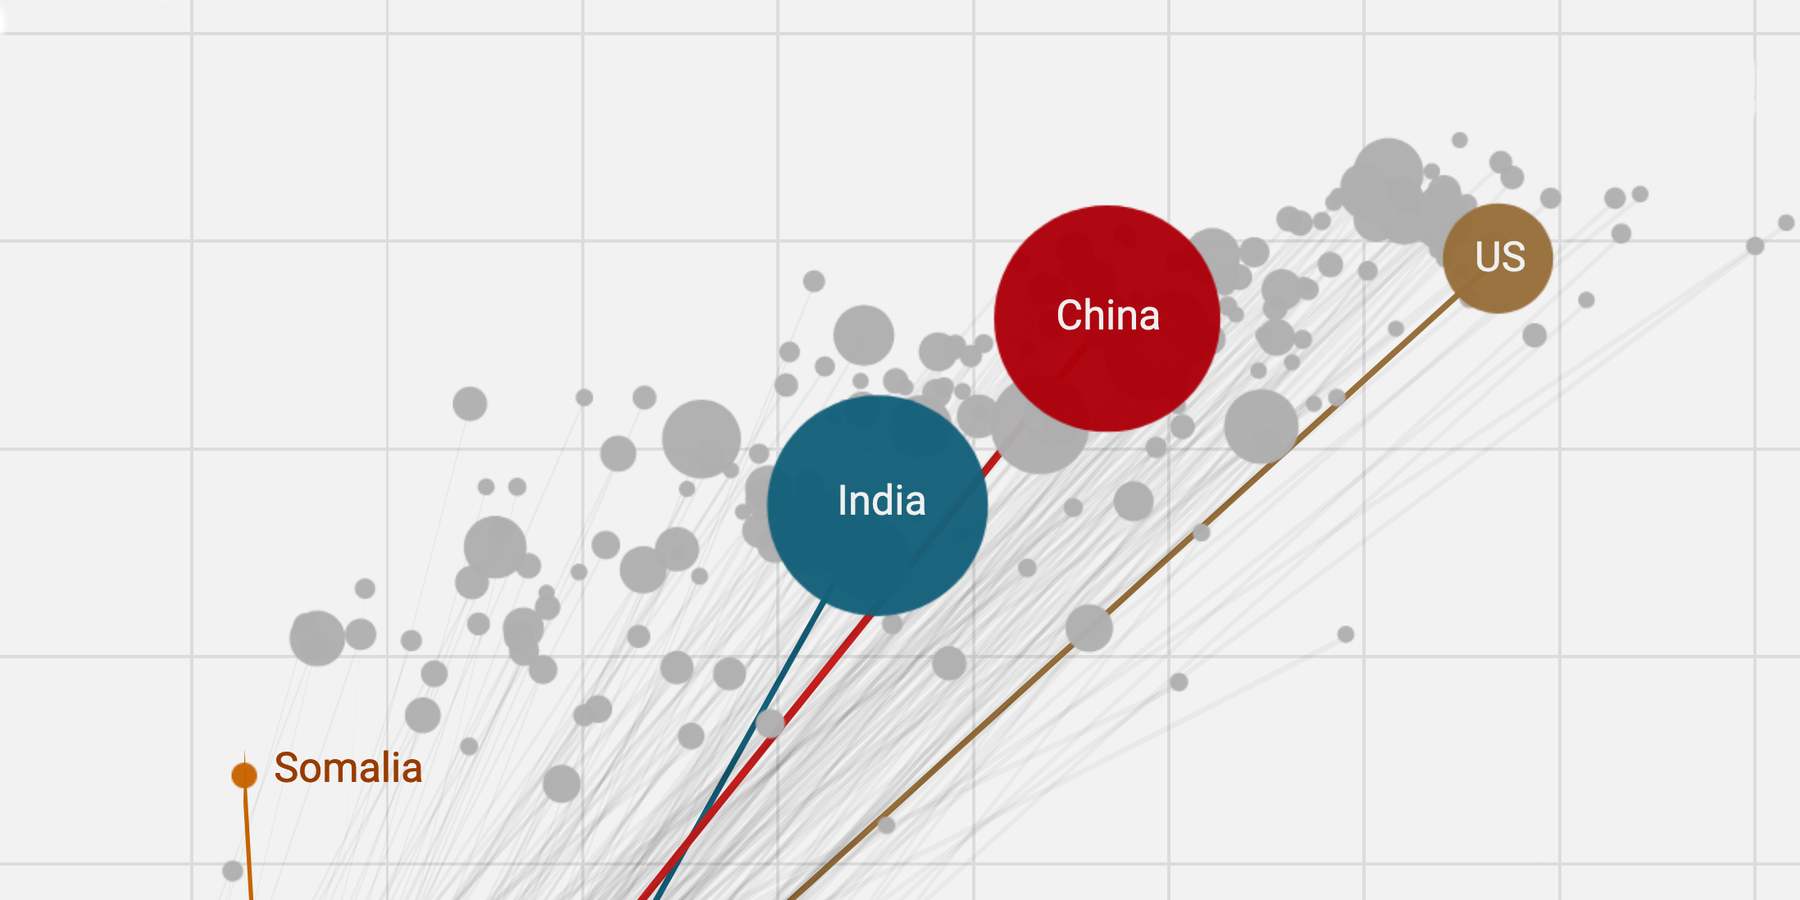
For our feature announcement “New: Automatically label data points in line charts”. Read it here.
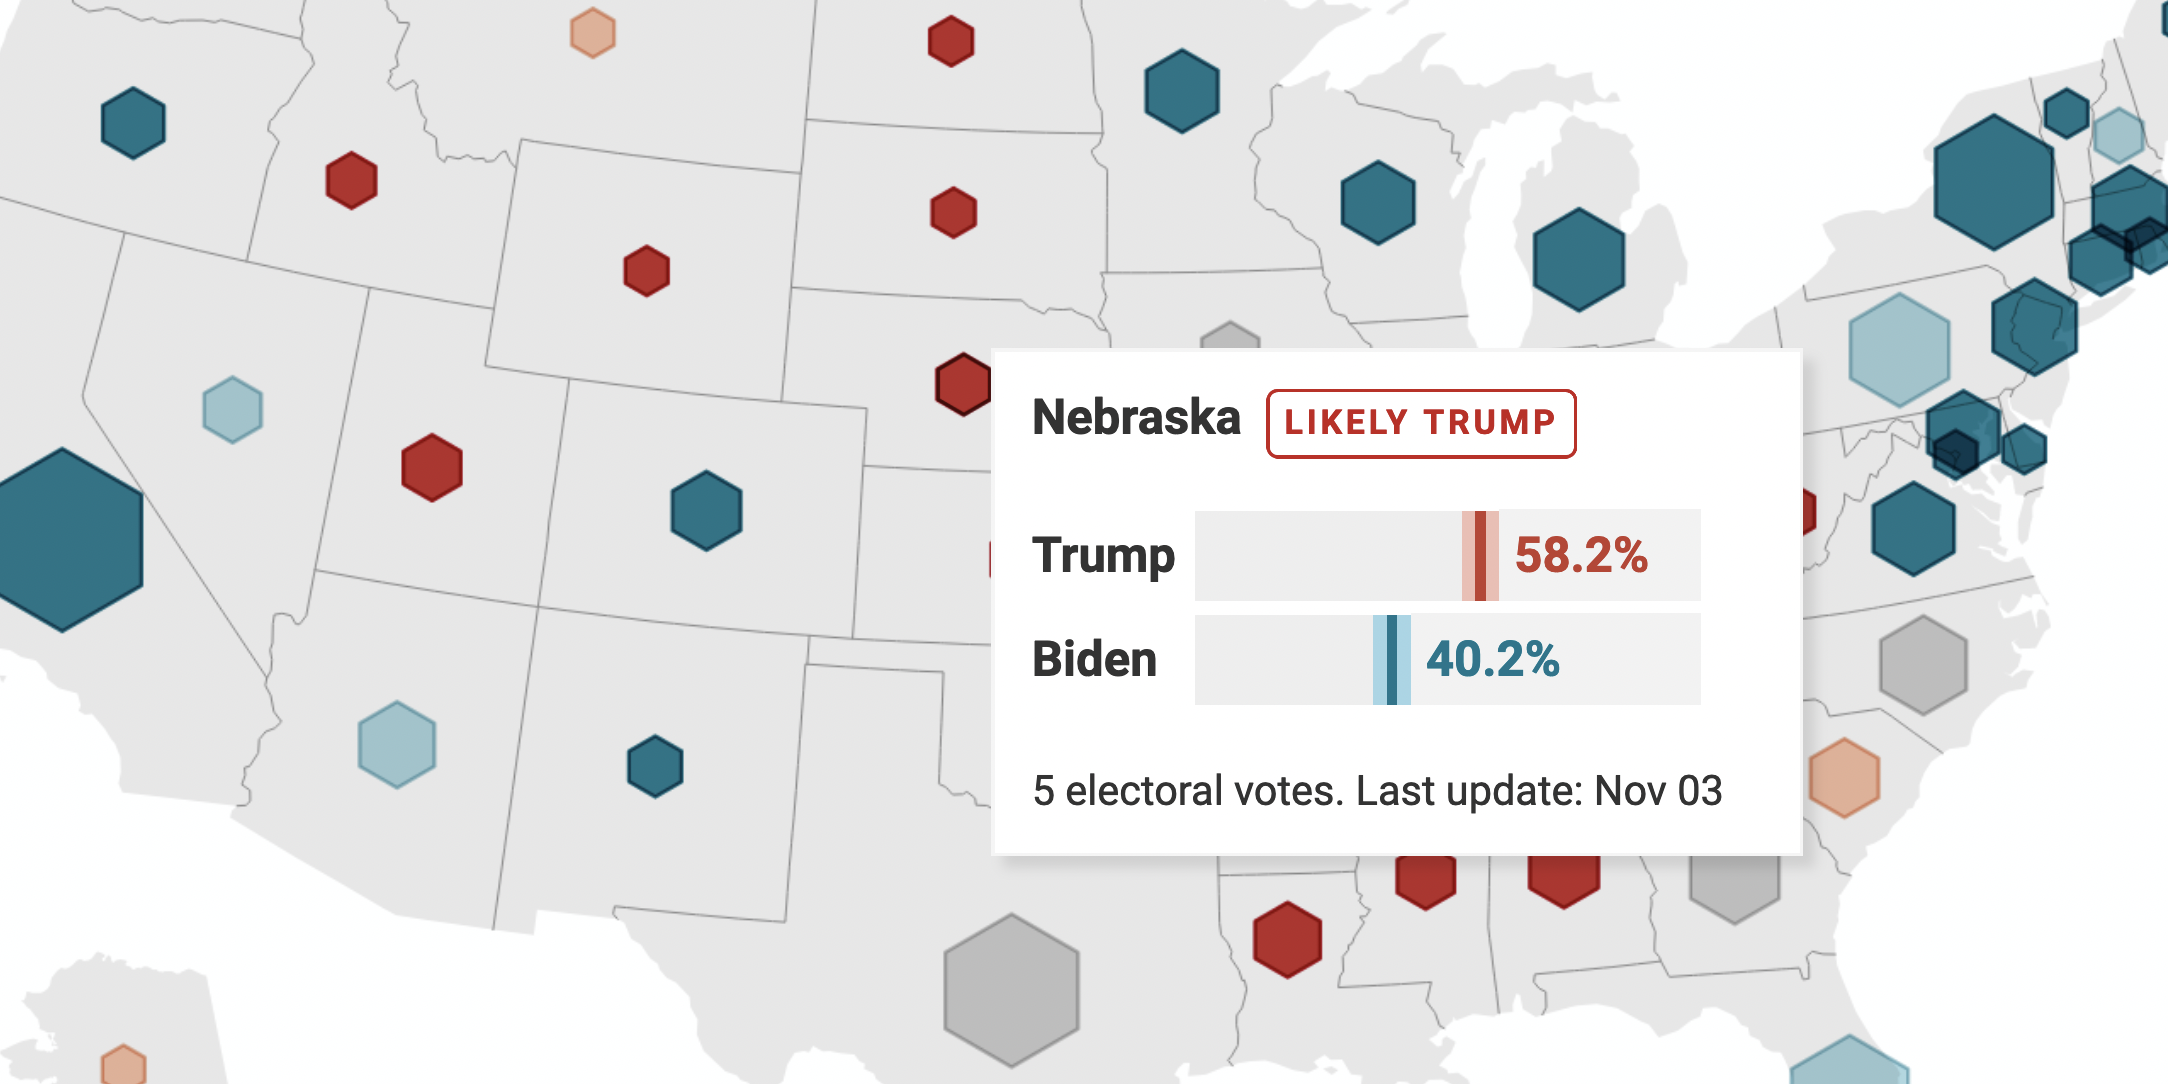
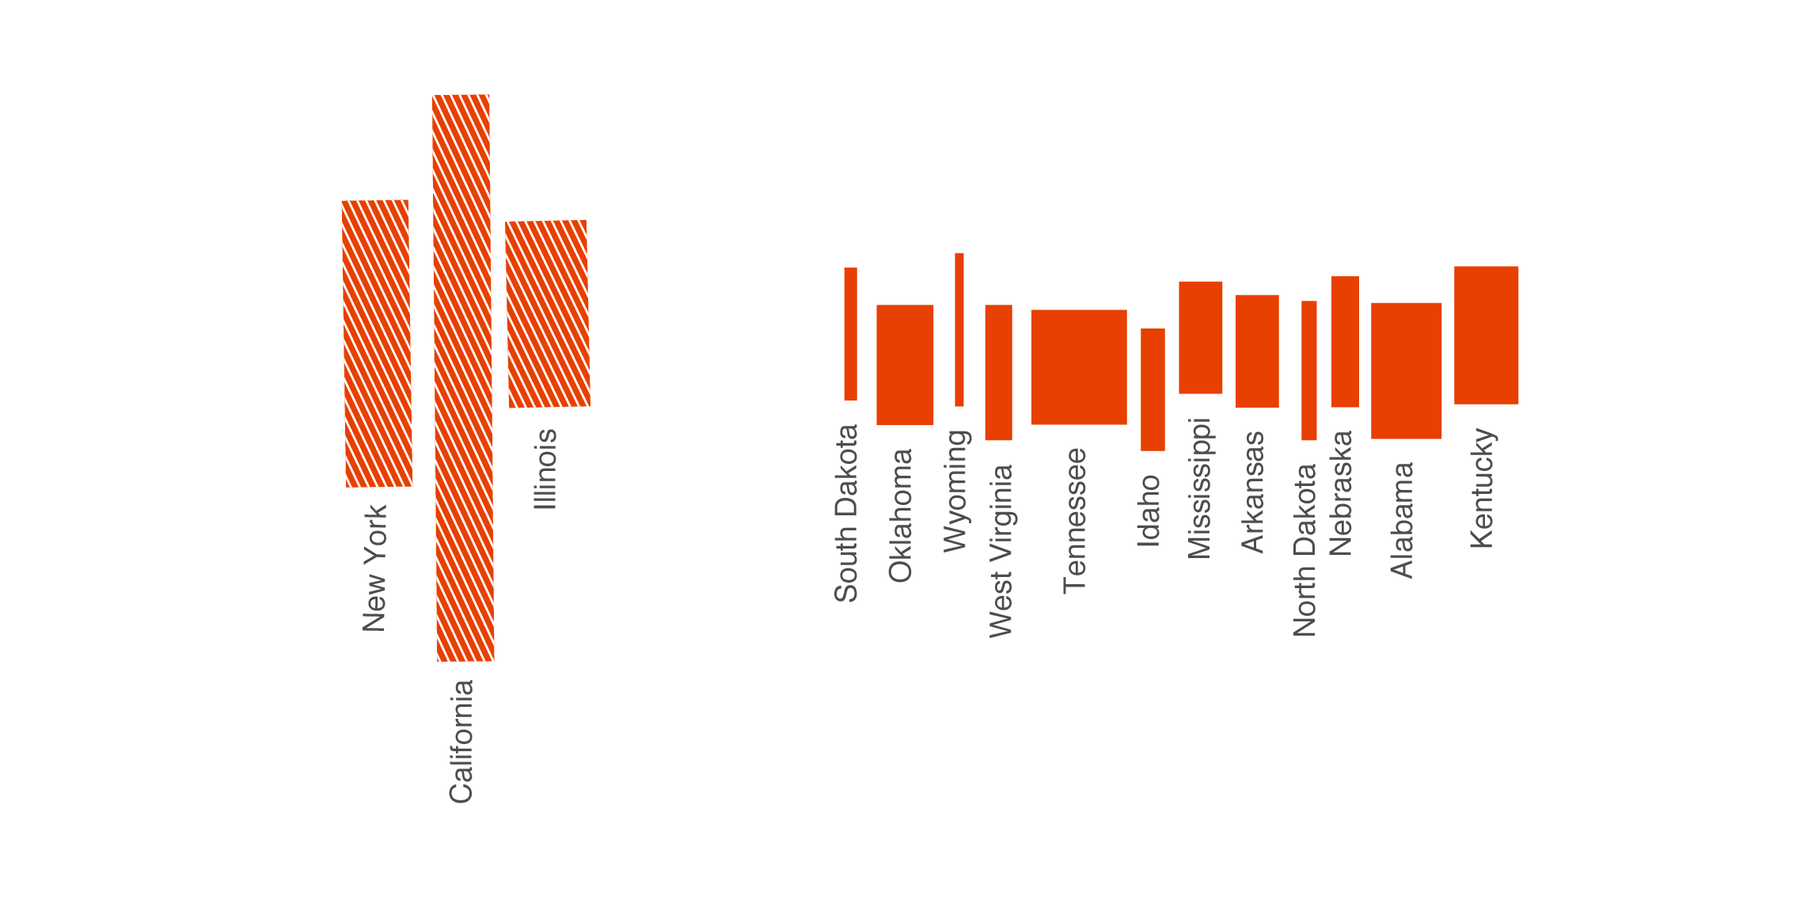
For our feature announcement “New: Add patterns to choropleth maps”. Read it here.
For our feature announcement “New: Small multiple line charts in Datawrapper”. Read it here.